Last week I wrote about the way in which price interacts with Hurst’s cyclic tool, the Future Line of Demarcation (FLD). Sometimes price crosses the FLD, sometimes it tracks along the line, and sometimes it bounces off it. Fortunately this is not a random series of interactions, but one that follows a sequence (the basis of the FLD Trading Strategy).
As the US markets drop down from last week’s peak they are completing a clear sequence of eight interactions which we label A – H. The final two interactions between price and FLD, G & H, lie ahead.
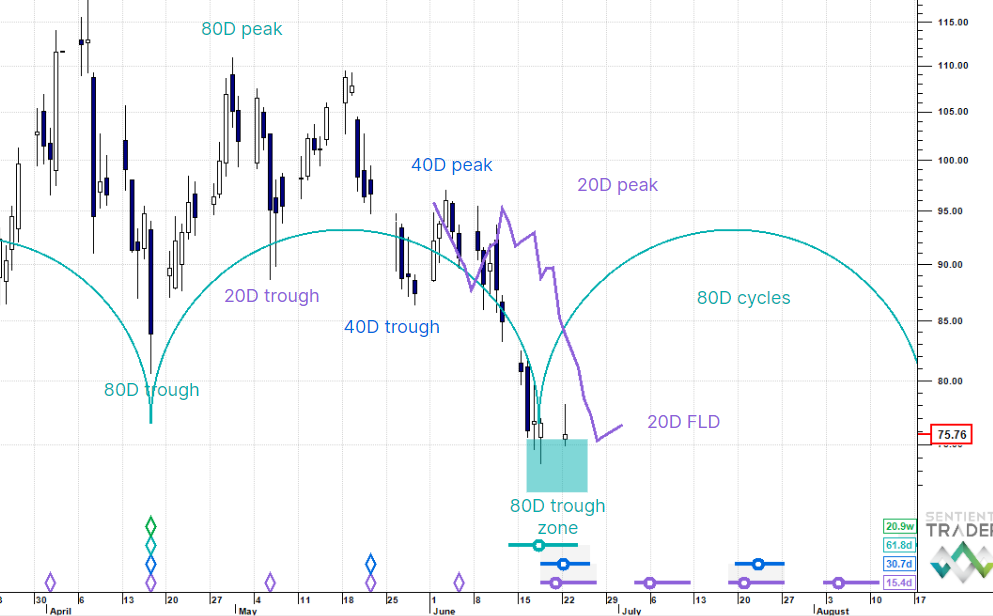
S&P 500
Here is the clear sequence with the 20-day FLD (the purple line on the chart) in the S&P 500 following the 20-week cycle trough of late February:

A good clear cross at A; price tracks along the FLD between B & C; D is a clean cross with an accurate projection, as is E (discussed last week). This week’s interaction is an F, and we expect G next. A “G-interaction” is when price is drawn back to the FLD, touches it, perhaps crosses it slightly, and then drops away again in an H-interaction.
Nasdaq
The Nasdaq is also showing a textbook sequence of interactions. The expectation here too is for price to rise back to the FLD in a G-interaction, and then to drop further in the H-interaction.

Euro/US Dollar
The Euro came back down to the FLD this week in a typical B-interaction where the FLD provides support to price. The G – H sequence that preceded the 40-week cycle trough in early April can be seen clearly on the left of the chart.

Gold
I mentioned last week that Gold’s break of support was bearish, and indeed it was. The next cyclic event of note for Gold is a B-category interaction with the 40-week cycle FLD (the green line on the chart) as Gold climbs back up to form a 40-week cycle peak. B-interactions are often “reaching” interactions where price reaches towards the FLD but does not touch it, and that seems likely here.

30Year US Bonds
Bonds continued their climb to the 40-week cycle peak, and reached closer to the target a little above 150 discussed last week. The 40-week cycle is due now, and should form shortly.

Crude Oil
Last week I wrote about the way in which price bounced down from the 20-day FLD. That was a typical G – H interaction sequence as can be seen here:

That provides us with an idea of what we can expect from the upcoming G – H sequence in the US markets. Double G – H sequences often occur, and so it is too soon to identify the 18-month (or longer) cycle trough in Crude Oil.
US Dollar Index
The US Dollar has now formed the 80-day cycle trough we have been expecting. The Dollar has further upside momentum in it as it moves up to the second peak of the M-shape of the 20-week cycle.

Identifying the sequence of price and FLD interactions is a very useful way of confirming or questioning your analysis, and is also an important part of making the correct trading decisions as we discuss every week in The Hurst Trading Room.
Have a great week and profitable trading!