Before we discuss the markets, have you registered for our first LIVE Hurst Trading Room webinar? It is going to be on Monday 14 September 2015, at 2 pm in Europe, 8 am New York, and 10 pm in Sydney. We will be doing these live webinars on a weekly basis, and if you cannot attend live you will be emailed a link to the recording if you have registered. So go ahead and register now: http://0s4.com/r/HTREG
I look forward to seeing you there!
For some time now I have been observing bearish “cracks” appearing in the stock markets, and I have become that irritating analyst who keeps on pointing out the negative.
But the speed of the drop in August took me by surprise. I was expecting the symmetry that I discussed in this post to break down on the bearish side, but not quite so fast!
To receive these blogs as soon as they are posted Join/Like/Follow Us. If you don’t do social media – click to Join Feedburner to receive these blogs by email.
The speed of that drop makes it seem likely that the 40-week cycle trough did not form in early July as I assumed at the time, but that it occurred at the end of August, or perhaps is yet to form (because the bounce has so far been a miserable affair, and that trough doesn’t look very certain).
I say that it “seems likely” because in fact it is still possible that the 40-week cycle trough DID occur in early July. That possibility has very bearish implications and I will get back to it later, (it is only a possibility and it would be better to discuss the more likely scenario first).
Now that we have such a deep trough to work with (and bear in mind that it might not have actually formed yet), we should question whether this is a trough of 40-week magnitude. And can it shed light onto the difficult straight-line bull periods that have recently been making our analysis more complicated?
An 18-month cycle trough
This recent trough is certainly deeper than the trough in October 2014, and so it is natural to assume that this is in fact a greater magnitude trough than October 2014. Here is a chart of the S&P 500 (ES futures) that shows that analysis:
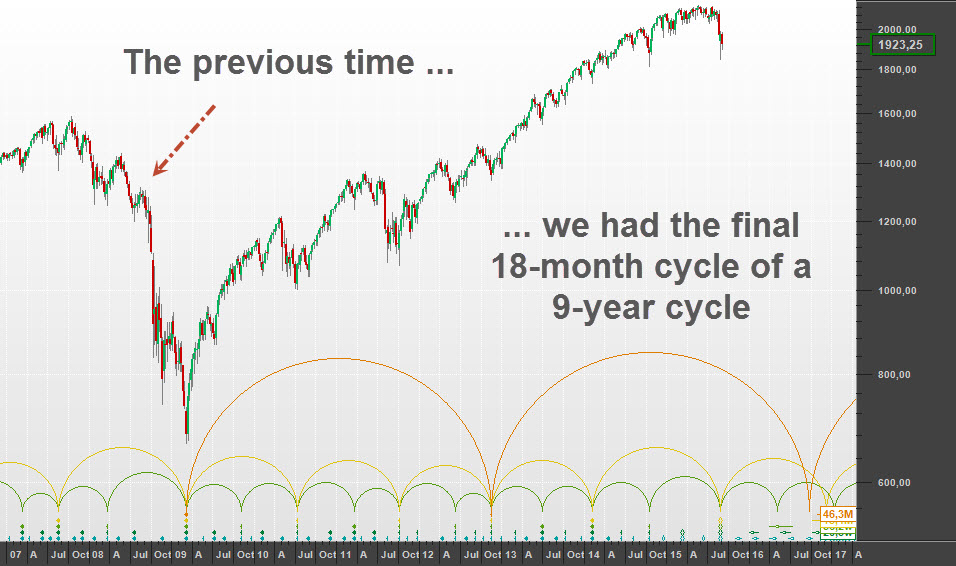
This analysis makes perfect sense, but just in case you think that identifying this trough as an 18-month cycle is good news (surely we should get a good bounce out of an 18-month cycle trough?), I have indicated on the chart the previous time that we lived through the final 18-month cycle of a 9-year cycle.
Of course if the March 2009 trough was also a trough of the 18-year cycle then we are in for less of decline, but that will have to be a discussion for another post.
What happens next
Looking in a little more detail at what lies ahead:
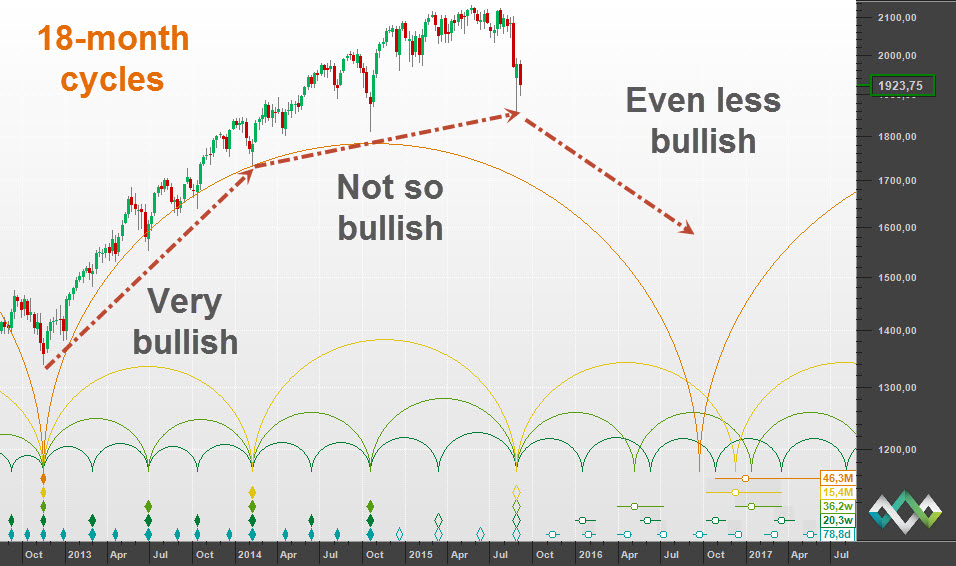
We see here the expected sequence of a bullish 18-month cycle, followed by a less bullish 18-month cycle … and next is an even less bullish cycle (which is nice way of saying a bearish cycle). And so we are expecting a bearish 18-month cycle into early 2017. The 18-month cycle trough isn’t such good news after all.
What if it is a 40-week cycle trough?
But I mentioned above that it is “natural to assume” that because a trough is deeper, it is of greater magnitude. It might be natural, but it is not actually true. The depth of a trough is not determined only by the magnitude of the trough, but also by the combined pressure of all longer cycles. And so it is quite possible that the current trough is only a 40-week cycle trough, made deeper because of an increased bearish underlying trend.
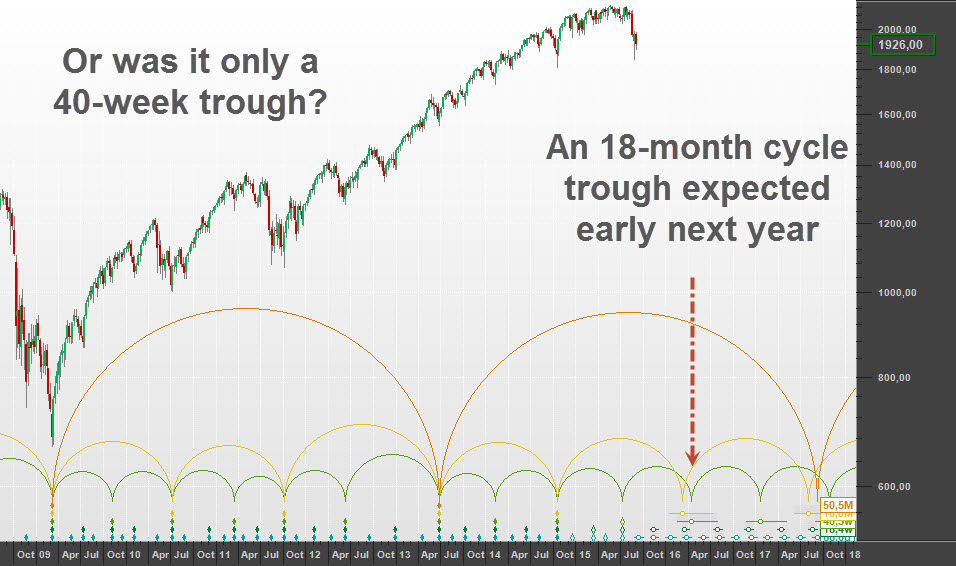
As is so often the case with a Hurst Cycles analysis the difference is fairly subtle. If this is the correct analysis then we are still looking ahead to a period of bearish moves, but the rhythm will be slightly different. In particular we should see the formation of the 18-month cycle trough early next year … but that won’t be a particularly celebratory moment, for the reasons discussed above.
The worst case
But now let’s get back to the rather devastating comment I made earlier: it is still possible that the 40-week cycle trough did occur in July 2015. I hasten to add that I don’t think this likely, but the consequences are so devastatingly bearish that it would be irresponsible not to mention it. Here is an analysis that phases the July trough as a 40-week cycle trough:
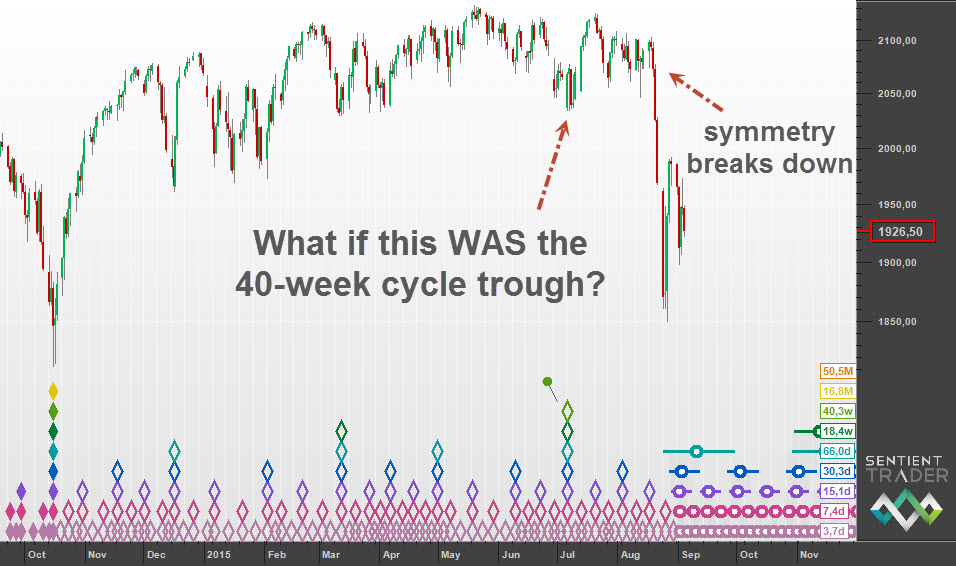
The analysis looks very reasonable, and is the analysis I was working with before I took a break over August. There are many things to like about the analysis – the troughs are all well placed (troughs in the phasing are good clear troughs in price), and the 40-week cycle came in 10 days early, as opposed to 41 days late.
I show the comparison analysis on the Hurst Cycles website if you have a bit of extra time.
Why do I describe the possibility that the 40-week cycle trough did occur in July as “devastating”? Because if that is the correct analysis then the very bearish cycle shape that we have seen since July (an 80-day cycle which is still playing out) is getting its bearish momentum from the underlying trend composed of cycles 9-years and longer. Those are the cycles that have given us such a great bull run. This scenario (if it is correct) indicates clearly that they have turned bearish, and we are likely to see bearish markets for many years.
Ending on a positive note: make sure you register for our first LIVE Hurst Trading Room webinar! It is going to be on Monday 14 September 2015, at 2 pm in Europe, 8 am New York, and 10 pm in Sydney.
I look forward to seeing you there!

