I wrote recently about the 40-week cycle trough that I am expecting to form soon. At that time I expected the trough to occur either early June 2015, or mid-July 2015, with the latter my preferred option. The market tantalizingly formed a trough in early June, but in my opinion that was most probably a 40-day cycle trough, and the 40-week cycle trough still lies ahead of us, as shown in this chart:
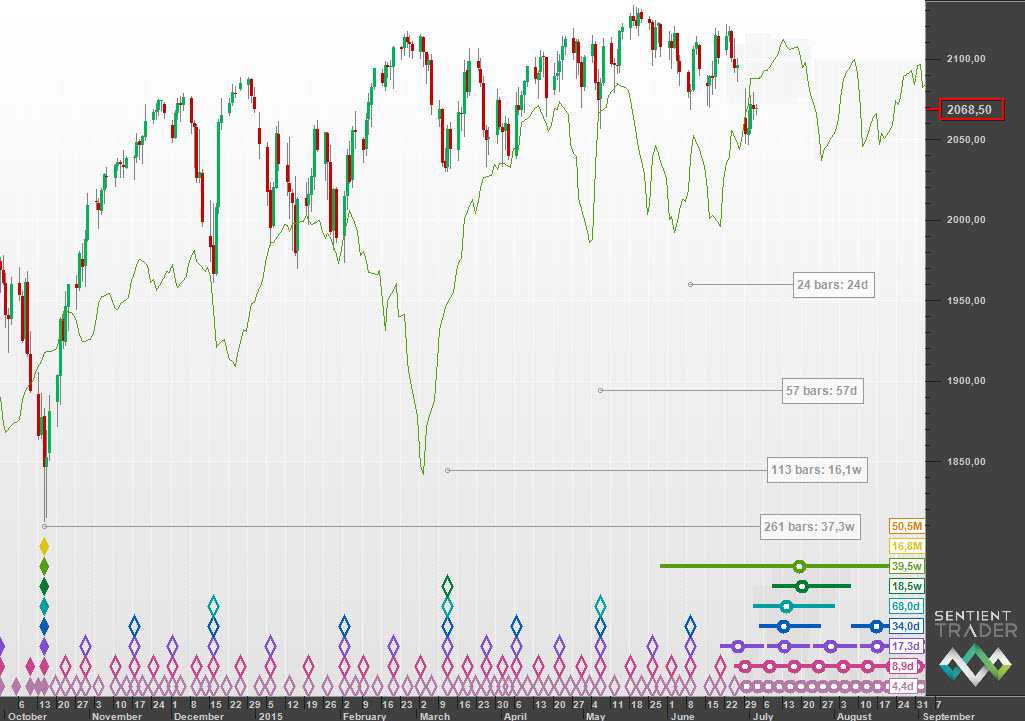
The bar counts indicate that we have another 11 to 23 days to wait until the trough forms (assuming that the cycles clock in at their average wavelength).
One of the pieces of information that we can glean from an FLD is that a trough of the cycle upon which the FLD is based is likely to form at about the time of a peak in the FLD. This chart shows how that indicates a similar time for the trough:
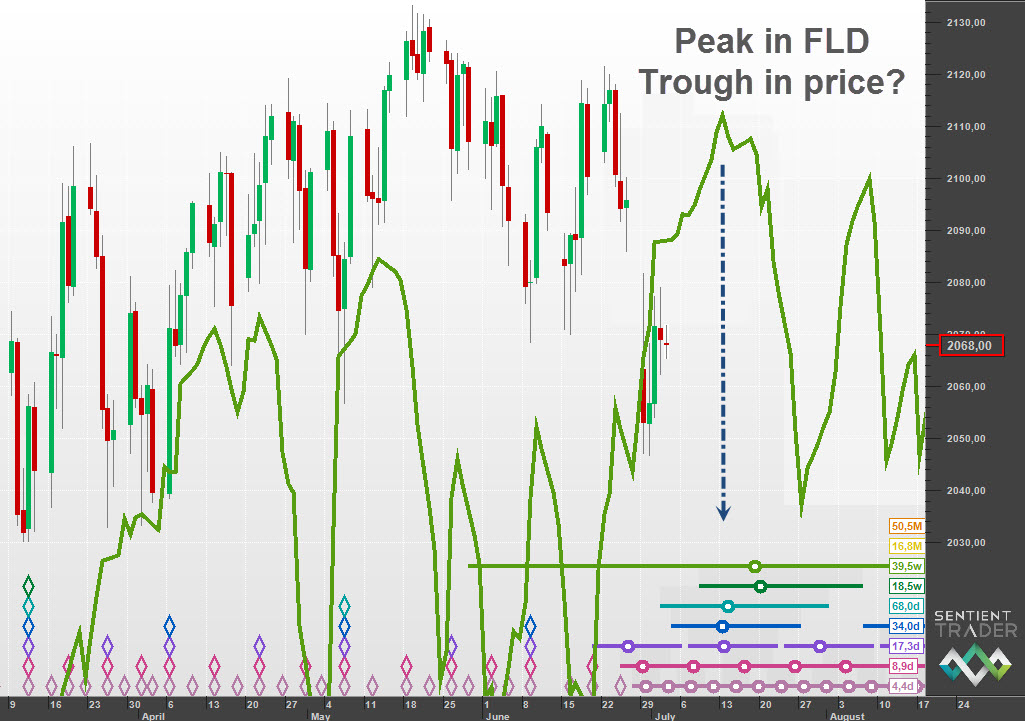
Notice how this week’s dramatic drop (an example of fundamental interaction in my opinion, as discussed in this week’s Hurst Trading Room podcast) found support at roughly the level of that FLD. This is a support that I don’t expect to hold, as discussed in this post.
Price has been “tracking along” the FLD this week, but I expect it to peel away to the downside, and then to remain below the 40-week FLD all the way down to the next 18-month cycle trough which I expect in early 2016.
What if the October 2014 trough was NOT an 18-month cycle trough? I discuss that possibility in the longer version of this post on the Hurst Cycles site.

