Hurst’s Cycle Tools (the VTL and FLD) are very useful as analysis tools, helping us know when a trough or peak has formed in the market. And they are useful for trading, by providing entry and exit levels. But they are also clearly levels that have some significance to the market. By this I mean that price seems to “react” to both the VTL and FLD, often finding support or resistance at the levels of these lines.
You probably know that I like to trade the interaction between price and the FLD, because I find it the most reliable. But there is another behavior that I have observed many times, which I call the “Cycle Jump” (just because I like to give things names).
The Cycle Jump is the move that takes place between a VTL line and the FLD line. It is usually a strong move and only occurs when the VTL line is closer to price than the FLD (which is usually the case, but not always).
The S&P 500 has provided a perfect example of the Cycle Jump over the past few weeks:
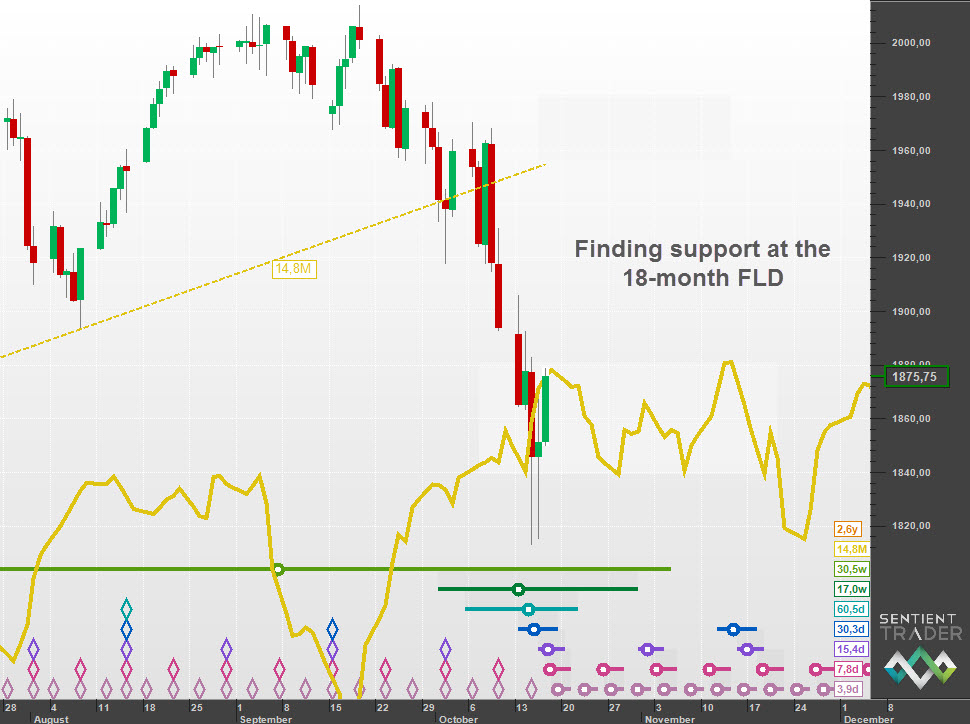
The Cycle Jump is that strong move from the 18-month VTL (once price finally let go) to the 18-month FLD. Price has found support at the level of the FLD, and is probably forming the 40-week trough here. Of course whether price finds support at the FLD or slices through it is a question of where we are in the sequence of price and FLD interactions.
If you would like to see a longer term picture and outlook for the next two years, please read my post on the Hurst Cycles site: http://hurstcycles.com/the-cycle-jump/
In that post I explain that I expect a bounce now out of a 40-week cycle trough, and then I’ll be looking for an 18-month cycle trough April – August next year (probably in the later end of that range), and of course the big 4 & 1/2 year cycle trough in late 2016.
Have a great week and profitable trading!

