The FLD (Future Line of Demarcation) is a very useful aid in the analysis of a market, and also for making trading decisions. Anyone who uses the FLD to inform trading decisions will quickly discover that not all FLD and price interactions are equal. Sometimes when price crosses an FLD it will result in a perfect trade, accurately achieving the target generated by the cross of the FLD, but on other occasions the trade will fail miserably with price reversing a little beyond, or at the level of the FLD and getting nowhere near to the target.
The realization that not all FLD and price interactions are equal was the germination of the FLD Trading Strategy, which recognizes that the interactions between price and the FLD follow a sequence (there are eight interactions with the 20-day FLD in every 80-day cycle).
Not only is this sequence consistent, there is also a consistency to the “character” of each interaction in the sequence. Perhaps it is my film background which causes me to see a story and characters in everything, but I have found it very useful to confirm my analysis by considering the character of the current interaction between price and an FLD.
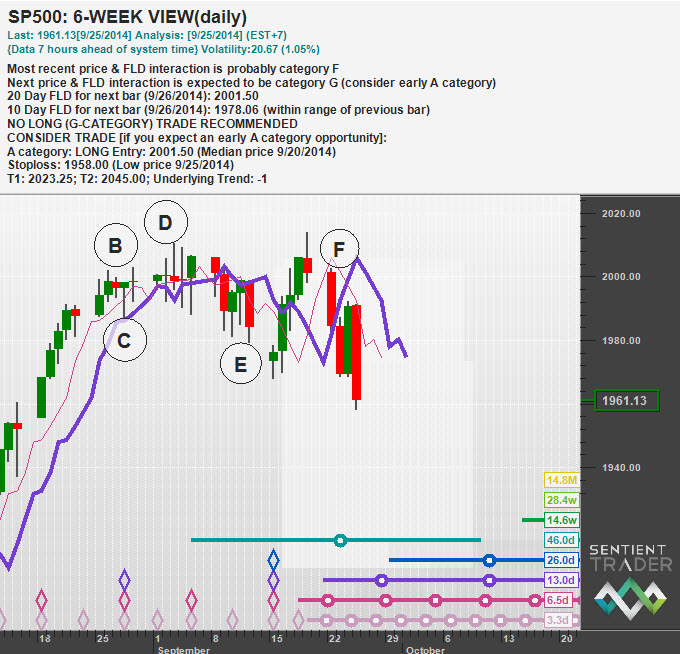
The current interaction between price and the 20-day FLD in the US markets (and other stock markets around the world) is a category F interaction. It is the sixth interaction between price and the FLD since the trough in early August, and it usually results in a good profitable short trade as the market moves down to an 80-day cycle trough. Here you can see the identification of the F-category interaction for the S&P 500 on the Hurst Signals system:
There is a characteristic of the F-category interaction that I have observed many times, and which I consider to be part of the defining “character” of the interaction. This is the way in which price “pulls back” to the FLD after crossing it. Often this occurs in the few bars (or days) after the cross occurs, in which case I consider it a “pull back”, but sometimes it occurs later, and is in fact the next interaction between price and the FLD, the G-category interaction. The character of the G-category interaction is that price will pull back towards the FLD, often touch, sometimes cross it slightly and sometimes not quite reach it. Here is the “pull back” that we witnessed this week:
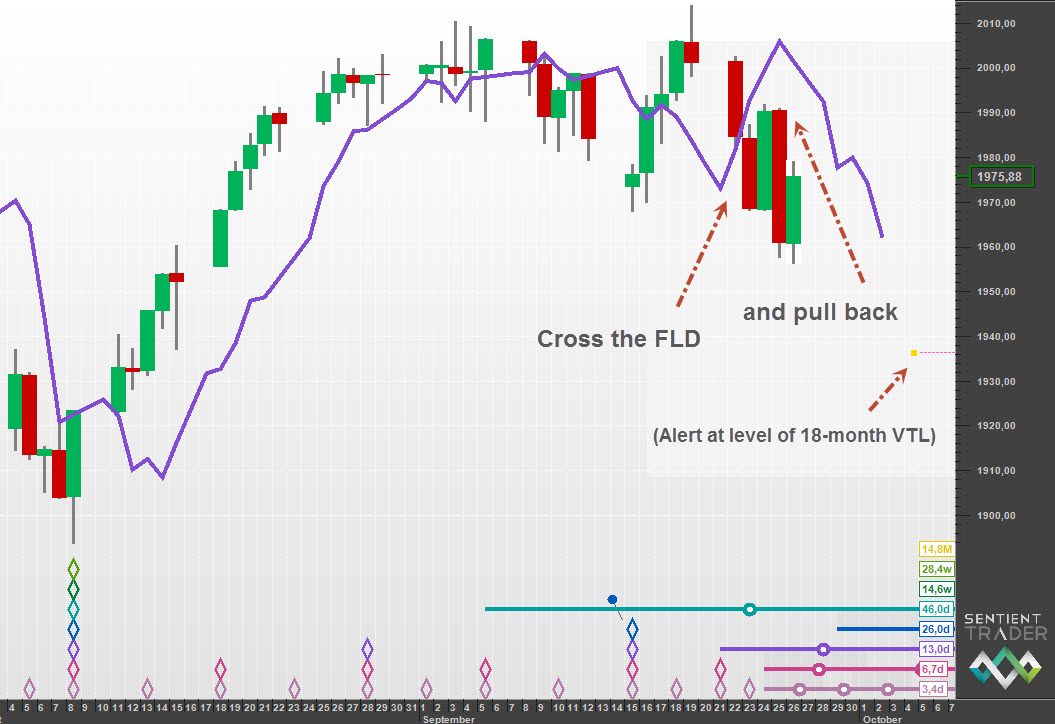
Whether the pull back is a short term attempt to reach the FLD, or a later G-category interaction, the fact is that it is a common characteristic of the F-category interaction, and I find it useful in confirming that my analysis is correct.
There have been 10 80-day cycles in the S&P 500 since June last year (according to my analysis), and we have seen pull back moves in the F-category interaction in 9 or those 10 cycles. If you would like to see charts of those examples you will find them here: http://hurstcycles.com/the-fld-pullback/
There have been two other posts on Hurst Cycles this week that are well worth reading:
José discusses his approach to analyzing the EURUSD: http://hurstcycles.com/eurusd-18-month-cycle-trough/
John discusses his analysis of the Canadian TSX: http://hurstcycles.com/tsx-toronto-stock-exchange/
Have a great week and profitable trading!

