Hurst’s Principle of Commonality states that financial markets around the world move with a good deal in common. What this means in practical terms is that troughs tend to form at the same times in all markets, and to a lesser extent peaks too form at the same time. However those troughs (and peaks) are not necessarily of the same magnitude in each market. Because of the harmonic ratios between the cycles, and the fact that cycle wavelengths vary, a particular trough can very easily have a different magnitude in a different market.
To receive these blogs as soon as they are posted Join/Like/Follow Us. If you don’t do social media – click to Join Feedburner to receive these blogs by email.
Here are my favorite analyses for a few stock indices. I will let the pictures speak for themselves in their expression of the principle of commonality, and mention just a few of the similarities and differences.
I wrote a few weeks ago about the magnitude of the August trough, and I continue to believe that trough was of 40-week magnitude in the S&P 500:
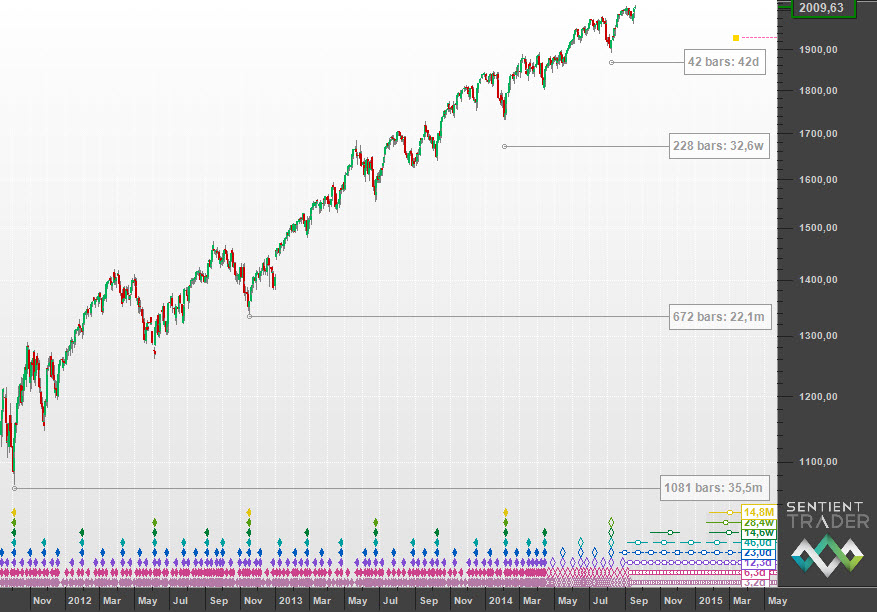
(That small purple dashed line at the top right of the chart is my VTL alert, based on the 18-month VTL as discussed last week)
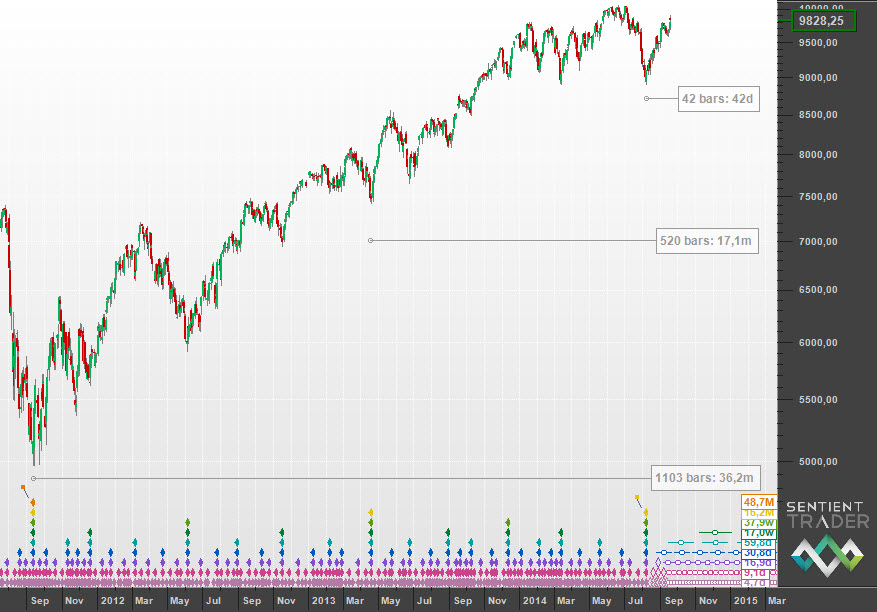
The Nasdaq is interesting because it presents a different picture (although showing troughs at the same times):
Notice how the trough of October 2011 which is so clearly a big magnitude trough in the S&P 500 and DJIA, is of only 80-day magnitude in the Nasdaq, with the big magnitude trough coming in a full 80-day cycle earlier. That syncopation has continued between the markets, with the most recent 18-month cycle trough in the Nasdaq phased in March 2014 (as opposed to February 2014 or October 2013). The August trough was most probably a trough of the 40-day cycle, with a possible 20-week cycle trough forming this week (while other markets formed troughs of 40-day magnitude).
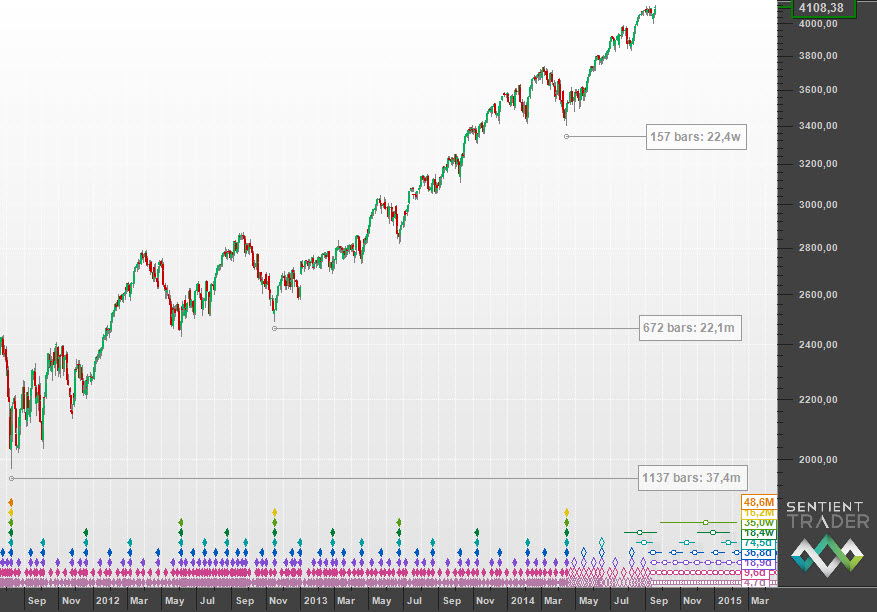
Crossing over the oceans, here is the German DAX:
The most notable difference in magnitude here is the April 2013 trough, which is of 80-day or 20-week strength in the US markets, but of 18-month import in this analysis. The other big difference is that here the August trough was most probably of 18-month magnitude.
An interesting observation to make is that there is commonality apparent in the nest-of-lows in the first two months of 2015. The troughs formed in the different markets will probably be of different magnitude, but they will most likely occur at the same time. Peaks are less reliable, but we are seeing a fractured picture beginning to develop with new highs in some markets (the US markets) and not in others (the DAX for instance, which should make it to new highs if it is bouncing out of the 18-month cycle trough)
This is an abridged version of the full post on the Hurst Cycles website, which includes charts of the DJIA and the FTSE. The Hurst Cyles website is a collection of Hurst analysis from many different analysts around the world.
Have a great week and profitable trading!

