I am so accustomed to the cycle trader’s approach of always looking ahead to the next event that I sometimes forget to “finish the story” and tie up the loose ends.
For the past few months I have been writing about when to expect the 40-week cycle trough. That trough has now occurred, almost exactly on schedule. Before we think about what comes next let me take a moment to illustrate the “power of cycles”, the insight which a cycle analysis can provide.
To receive these blogs as soon as they are posted Join/Like/Follow Us. If you don’t do social media – click to Join Feedburner to receive these blogs by email.
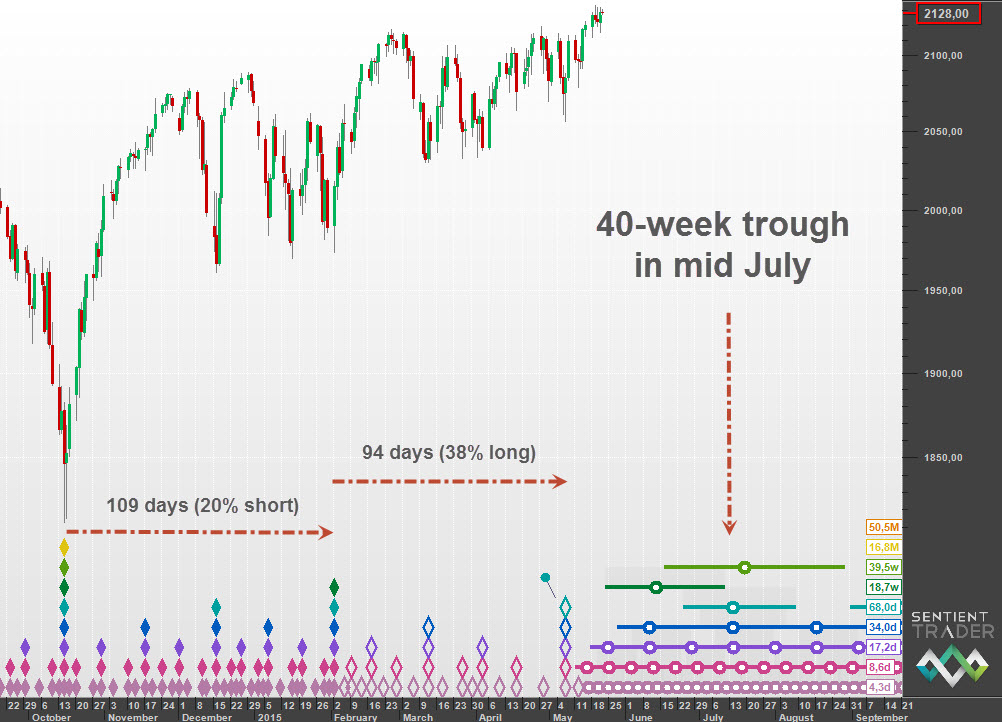
On May 22, 2015 I published this chart as one of two possibilities for when to expect the 40-week cycle trough:
Here is an updated analysis that shows the accuracy of that forecast:
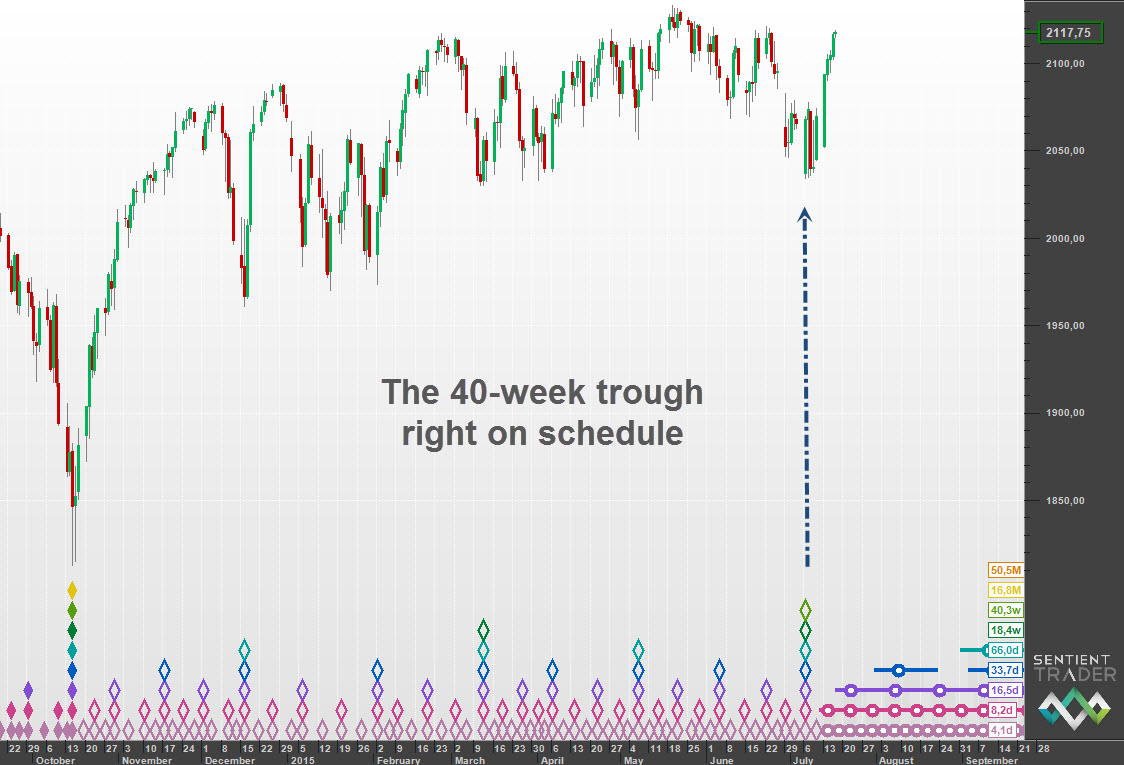
Perhaps it was a few days early, but when you’re talking about a 40-week cycle which averages 274 days I think 5 or 6 days can be forgiven. The question is, as always, what next?
It is a fact that when prices bounce out of a cycle trough the move usually starts off very symmetrical. In other words the rise out of the trough matches the plunge into the trough. We can see the nearly perfect symmetry of the past four weeks on this chart where I have simply copied and mirrored the price action:
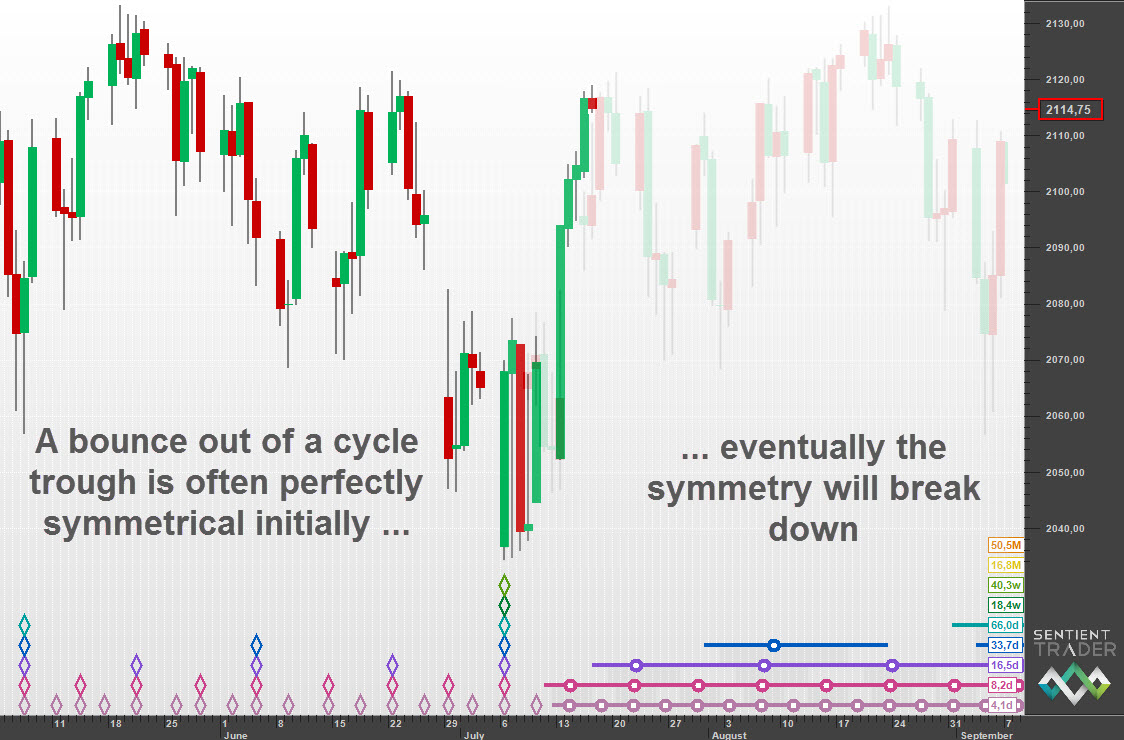
The pale bars are the mirrored price from before the trough. Notice how we are at exactly the same level we were at an equal number of days before the trough as we are now after it.
Eventually the symmetry will break down, and that break down is dependent upon the underlying trend. If the underlying trend is neutral then the symmetry will last for a long time. If it is bullish then the symmetry will break down to the upside (in other words new price action will be higher than the reflected price). And if the underlying trend is bearish then the symmetry will break down to the downside.
Underlying trend has been clearly bullish for some time, but I have been observing bearish signs appearing recently, and it will be interesting to see whether the underlying trend has been reduced to a neutral state yet, or even whether it has started to turn to bearish. The break down of symmetry will provide us with this vital information.
As a matter of interest if underlying trend is now neutral then this reflected price action shows us what to expect:
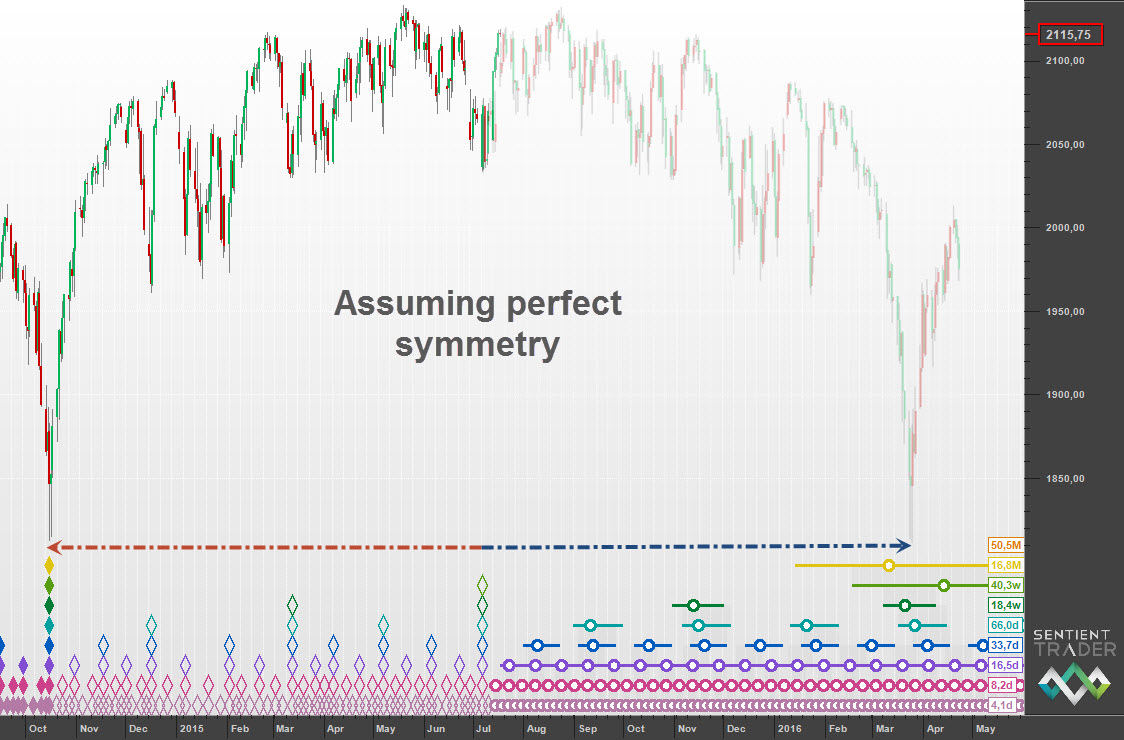
The concept of symmetrical price action is an interesting by-product of Hurst’s Cyclic Principles, and a very useful one in my opinion. Let me know where you think the next cycle is going to take us.

