The two weeks encompassing Christmas and New Year are difficult times to trade. It is one of the fundamental concepts of Hurst’s Cyclic Theory that cycles influence the prices of financial markets perpetually: 24 hours a day, 7 days a week, regardless of whether we are trading those markets, or are taking time off. Most traders don’t realize this, and so the trading that surrounds holidays is often very volatile as the markets try to find their correct level. Traders are mostly thinking back to the time before the holiday, but those levels don’t apply anymore because time has passed and the cycles have moved. The result is often some very volatile swings in price.
The year 2013 has started off with a tremendous surge upwards in the stock markets (in fact the surge happened almost entirely on the last day of 2012, and as a gap upwards on the first day of 2013, which was not a trading day). Some are seeing this as a portent for a great (bullish) year ahead, but I am not one of them. The market has bounced out of a 40-day cycle trough. There has been some additional volatility because of the holidays, but it is nevertheless a 40-day cycle bounce. Gaps come in various flavors, and soon we will see whether this proves to be a breakout gap or an exhaustion gap.
In my last post before Christmas I introduced an analysis that has the November trough phased as a trough of 18-month (at least) magnitude. The bounce into this new year raises the chances on this analysis, but it does not eliminate the preferred analysis that has that trough phased as a trough of the 20-week cycle, with a fall into the 54-month cycle trough imminent. This latter scenario is the more dangerous one and so we need to stay alert to the possibility of a hard fall into the 54-month cycle trough, while profiting from the current bull move.
In case the mention of alternate analyses leaves you trembling with “analysis paralysis”, and unable to make concrete trading decisions I must remind you of one of the greatest aspects of trading according to a Hurst Cyclic analysis: whichever analysis is correct, the trading decisions are mostly the same. For instance using the FLD Trading Strategy that we teach in the Hurst Cycles Trading Academy you would have entered a category E long trade as price bounced out of the 40-day cycle trough, regardless of which analysis you believed was the correct one. The only thing that would have been affected would have been the position size of the trade.
S&P 500
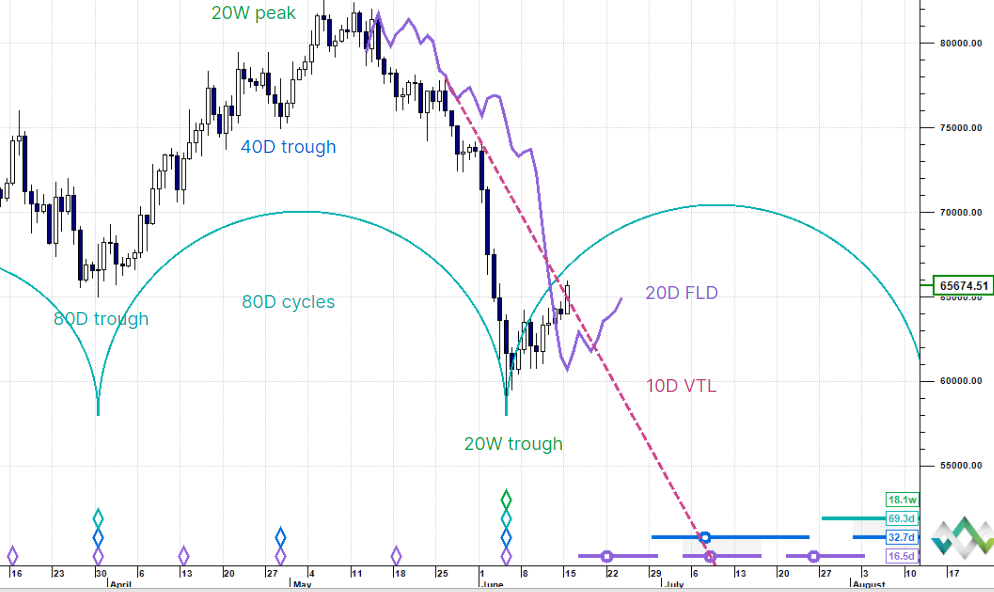
Here is my preferred analysis, which has the November 2012 trough as a trough of the 20-week cycle, and we expect price to move down soon into the 54-month cycle trough expected early this year.

The sudden jump up into the start of this year distorts the cycle shapes, and if the markets don’t turn down soon we will be dismissing this analysis and turning our attention to the analysis presented here (and previously) in the Nasdaq.
Nasdaq
This analysis has the November 2012 trough of at least 18-month, possibly even 54-month magnitude.

The recent strong move up makes more sense in terms of this analysis, but the market will have to sustain the upwards move for the analysis to stay in favor. Note here the early 40-day cycle trough implying that the current bounce is out of an 80-day cycle trough. Troughs occur early when the underlying trend (combined effect of longer cycles) is bullish.
Euro/US Dollar
The Euro has not been so enthusiastic about the new year, and it continues to display regular cycle shapes. The only question is whether the approaching trough will prove to be a late 40-day cycle trough, or an early 80-day cycle trough. Either way we are short into that trough.

Gold
Gold formed a disappointing, but likely 80-day cycle peak on the second day of this new year. It is possible that Gold will muster some strength and form a higher 80-day cycle peak, but if it doesn’t do so soon we will have to wait until the 20-week cycle peak forms in about March

30-Year US Bonds
I was presenting an alternate analysis in bonds before Christmas, but recent price action eliminates that alternate, and Bonds now seem to have fallen back in line with stocks (inversely).
")
Crude Oil
Crude Oil finally discovered some strength and has risen to a higher peak for the current 80-day cycle. This has formed a slightly more balanced M-shape for the current 40-week cycle. Crude Oil is still expected to turn down into the 54-month cycle trough expected in March-April of this year.

US Dollar Index
The Dollar bounced up into the new year following the formation of a late 80-day cycle trough, which we identified before Christmas. Of course the bounce out of the 80-day cycle trough is expected to be proportionally strong, but I continue to favor the more bearish outlook for the near term which has the dollar forming a 54-month cycle trough later this year.

Happy New Year and profitable trading!