The US stock markets have been going up inexorably for a good two years (at least). They formed what seems to be a very shallow 40-day cycle trough this week, its shallowness indicating that the bull is still going strong. And I wondered (as I have often recently) when we might expect this bull to lose steam, and when we are likely to see the peak of the current 54-month cycle.
To receive these blogs as soon as they are posted Join/Like/Follow Us. If you don’t do social media – click to Join Feedburner to receive these blogs by email.
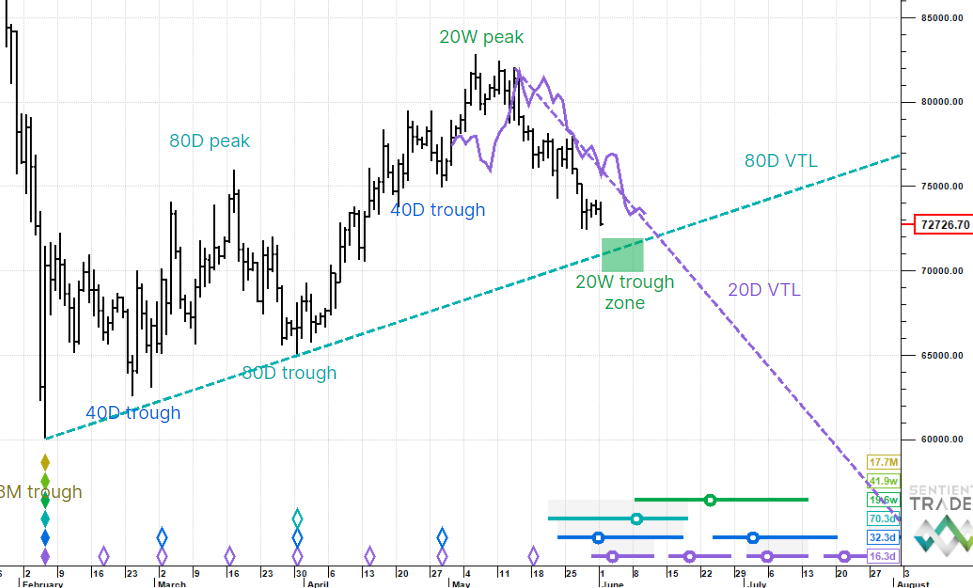
Identifying peaks is a notoriously tricky business because of the fact that Hurst cycles have synchronized troughs, which means that their peaks are not necessarily synchronized. But a very useful tool for identifying, or confirming, a peak is the VTL (Valid Trend Line). A VTL is a standard trend line which connects peaks or troughs, and it is validated by a few simple rules defined by Hurst.
In order to confirm the peak of a particular cycle you need price to cross below a VTL based upon the cycle one shorter than the cycle you are looking to confirm the peak for.
And so in order to confirm a peak of the 54-month cycle we would need price to cross below a VTL of the 18-month cycle. Here is a chart showing that VTL as well as a VTL of the 40-week cycle:
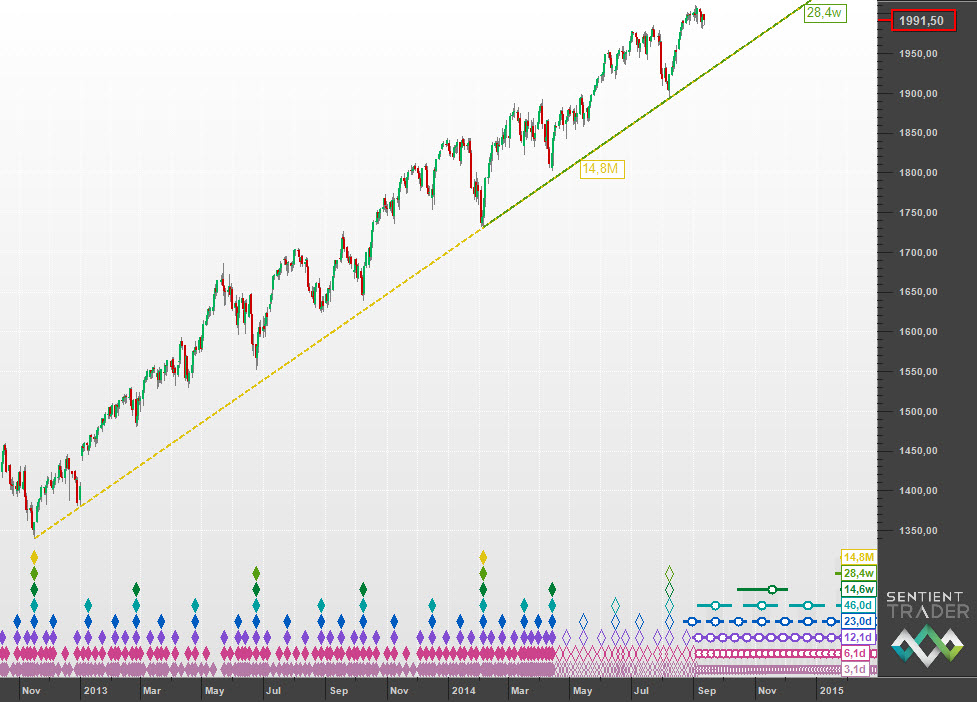
Of course that 18-month VTL is based upon the analysis that places 18-month troughs in November 2012 and February 2014, which could also be debated, but we will have to leave that discussion for another time (it is Friday afternoon after all …)
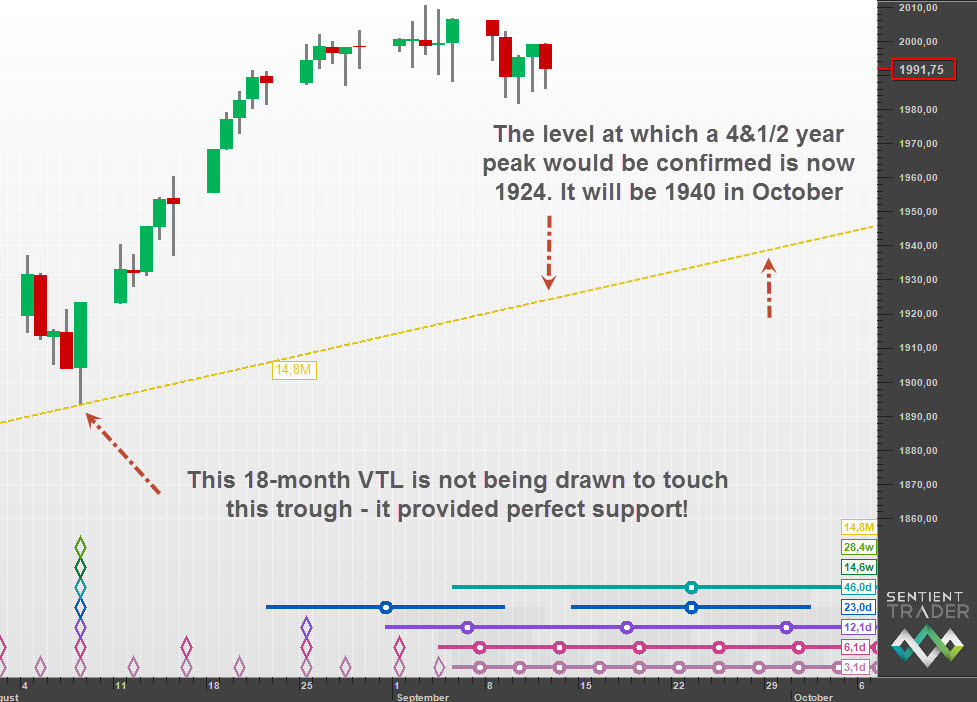
The reason that I plotted both VTLs on that chart is because of the remarkable perfection in their overlap. Bear in mind that a VTL is drawn between two consecutive troughs of the same cycle. Those troughs for the 18-month cycle I have given above. For the 40-week cycle the two troughs are February 2014 and August 2014. What is remarkable about that overlap is that the 18-month VTL has not been drawn to touch the August 2014 trough, but that trough came down to perfectly touch the 18-month VTL. Here you can see how accurately the 18-month VTL provided support as price came down to the August trough:
If price crosses below that 18-month VTL (assuming it is the correct 18-month VTL) then we will have confirmation that the 54-month peak has formed in the market, and the current bull party will be over. That 54-month cycle peak will probably also be a 9-year cycle peak, and so we should brace ourselves for a strong bear move, stronger than any bear move since early 2009.
That 18-month VTL is at a level of 1924 today, only about 70 points below the current price. Six days of average-range downwards movement would take us to that level. By the first week of October the VTL has climbed to above 1940.
Of course the peak is not confirmed until price does cross the VTL, and as I mentioned at the top of this post, the bull still looks strong. But when the market begins to turn we will know at what point we can say that the party is over.
This is an abridged version of the full post on the Hurst Cycles website (http://hurstcycles.com/a-valid-trend-line/). The Hurst Cyles website is a collection of Hurst analysis from many different analysts around the world.
Have a great week and profitable trading!