Last week I pointed out some bearish signs in the stock markets, a well timed post as it turned out because the US markets fell all week (at least until Friday morning when I am writing this). But interestingly the DAX spent the whole week going up (apart from some very volatile fundamental interaction surrounding the Swiss Franc announcement) and the FTSE provided a geographically appropriate mix between the two.
Is the bear over? I don’t think so. We are expecting a 40-day cycle trough soon of course, and so a bounce is in order. But the bearish signs that I mentioned last week are of deeper significance in my opinion. Today I would like to expand on the general bearish shift by discussing the interaction of price with the 20-day FLD.
You probably know that I find the interactions between price and the FLD (particularly the 20-day FLD) very useful to trade. The FLD Trading Strategy and Hurst Signals service are based upon these interactions. The FLD Trading Strategy trades a reliable sequence of eight interactions (labelled A to H) which occur between price and the FLD.
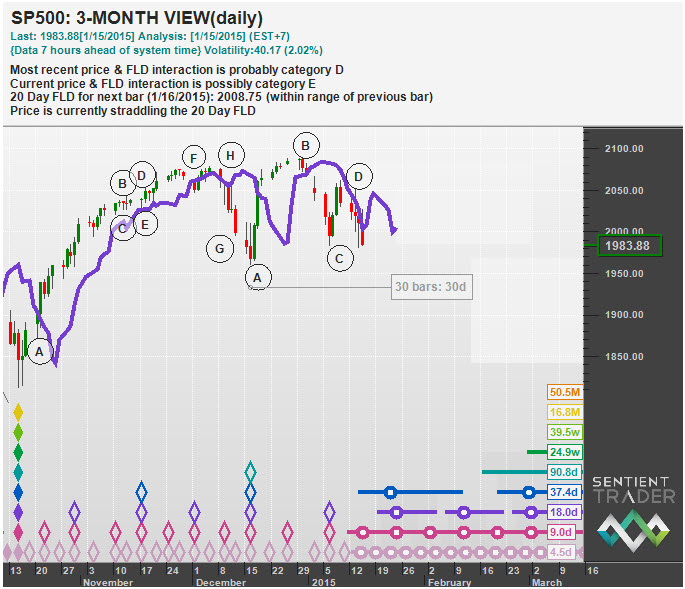
Let’s take a look at the interactions between price and the 20-day FLD. Here is the full sequence, as identified by the Hurst Signals system:
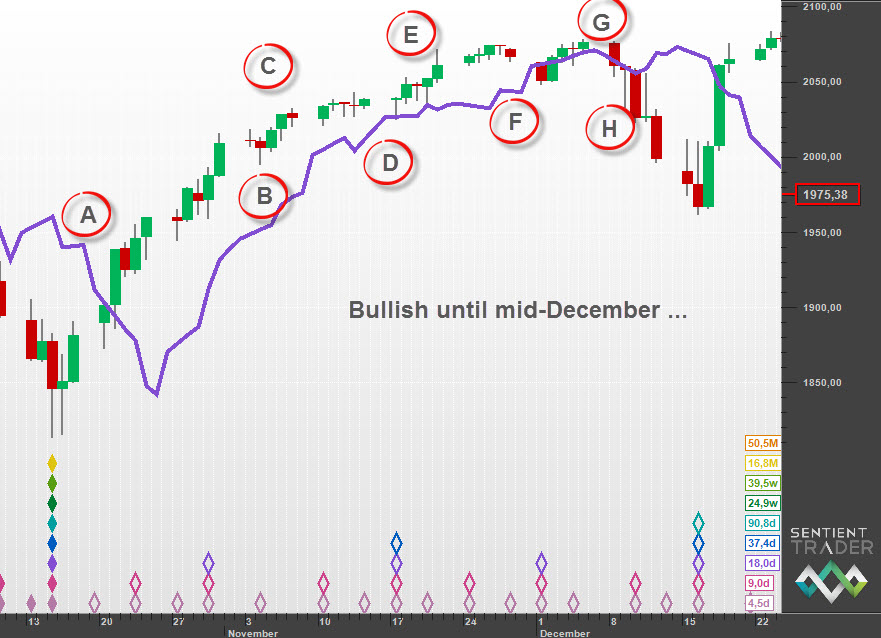
What is less apparent is the strong shift from bullish to bearish. Here is the full A to H sequence for the 80-day cycle from mid-October 2014 to mid December 2014:
It is easy to see that this is a bullish 80-day cycle. In case you are not familiar with the A to H sequence let me explain why this is a particularly bullish sequence:
- The A-category interaction exceeded its target of 1987.25.
- The B-category interaction reached towards the FLD, but didn’t come anywhere near it.
- The C-category interaction (as price pulled away from the FLD) took the market to new highs prior to the formation of the 40-day cycle trough.
- The D-category interaction was a bounce off the FLD, which provided support. Usually the D-category interaction is a “crossing” interaction which reaches its downside target accurately.
- The E-category interaction took the market to new highs.
- The F-category interaction was disappointing (as far as interactions go). It didn’t get anywhere near the short target, with price bouncing straight back up to track along the FLD. Tracking along the FLD between F and G interactions is rare, and only happens in very bullish markets.
- The G-category interaction occurred at a new high, which is bullish, but it didn’t get clear of the FLD (which would have been very bullish), and so here we can see the bull beginning to weaken.
- Finally the H-category interaction saw the market break down strongly – this was the only “not bullish” interaction out of all eight of them.
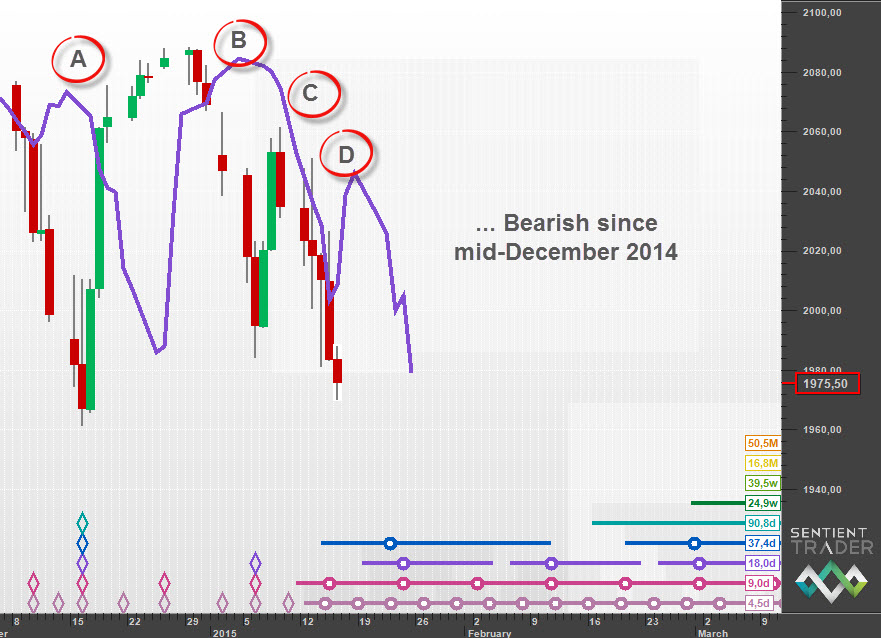
Now let’s look at the sequence so far in the current 80-day cycle:
Let’s go into the detail of how the interactions reveal a strong shift to bearish mode:
- The A-category interaction fell way short of its target (of about 2133)
- The B-category interaction usually sees price finding support at the FLD – the strong cross down below the FLD is very bearish.
- The C-category interaction usually takes price above the FLD for several days … but this interaction was a bounce, or several days of tracking along the FLD as it was moving down!
- The D-category interaction was merely a pull away to the downside.
Of course the current 80-day cycle is on the downward side of the current 20-week cycle, and so we do expect a shift towards bearishness, but I would suggest that the move from consistent bullishness to such sustained bearishness indicates a shift to bearishness of much greater magnitude than we would have expected.
I pointed out last week that the fact that the 80-day VTL had been breached indicated that the 20-week cycle peak was in place, and it seems to me that the chances are increasing that the peak at the end of December 2014 is of greater magnitude than 20 weeks.
Have a great week and profitable trading!


