This Cycle Outlook has been kindly provided by David Walling. (In case you missed the announcement about this new series, read this)
The analysis is provided for your consideration and is not to be construed as financial advice. Please bear in mind our disclaimers which apply to all posts on this site.
Please note: Any questions about the post will be answered by our team, not by David Walling, who has generously contributed his time (this is not a sponsored post).
Greetings, Here’s my current cyclic outlook. It does not include this morning’s price action.
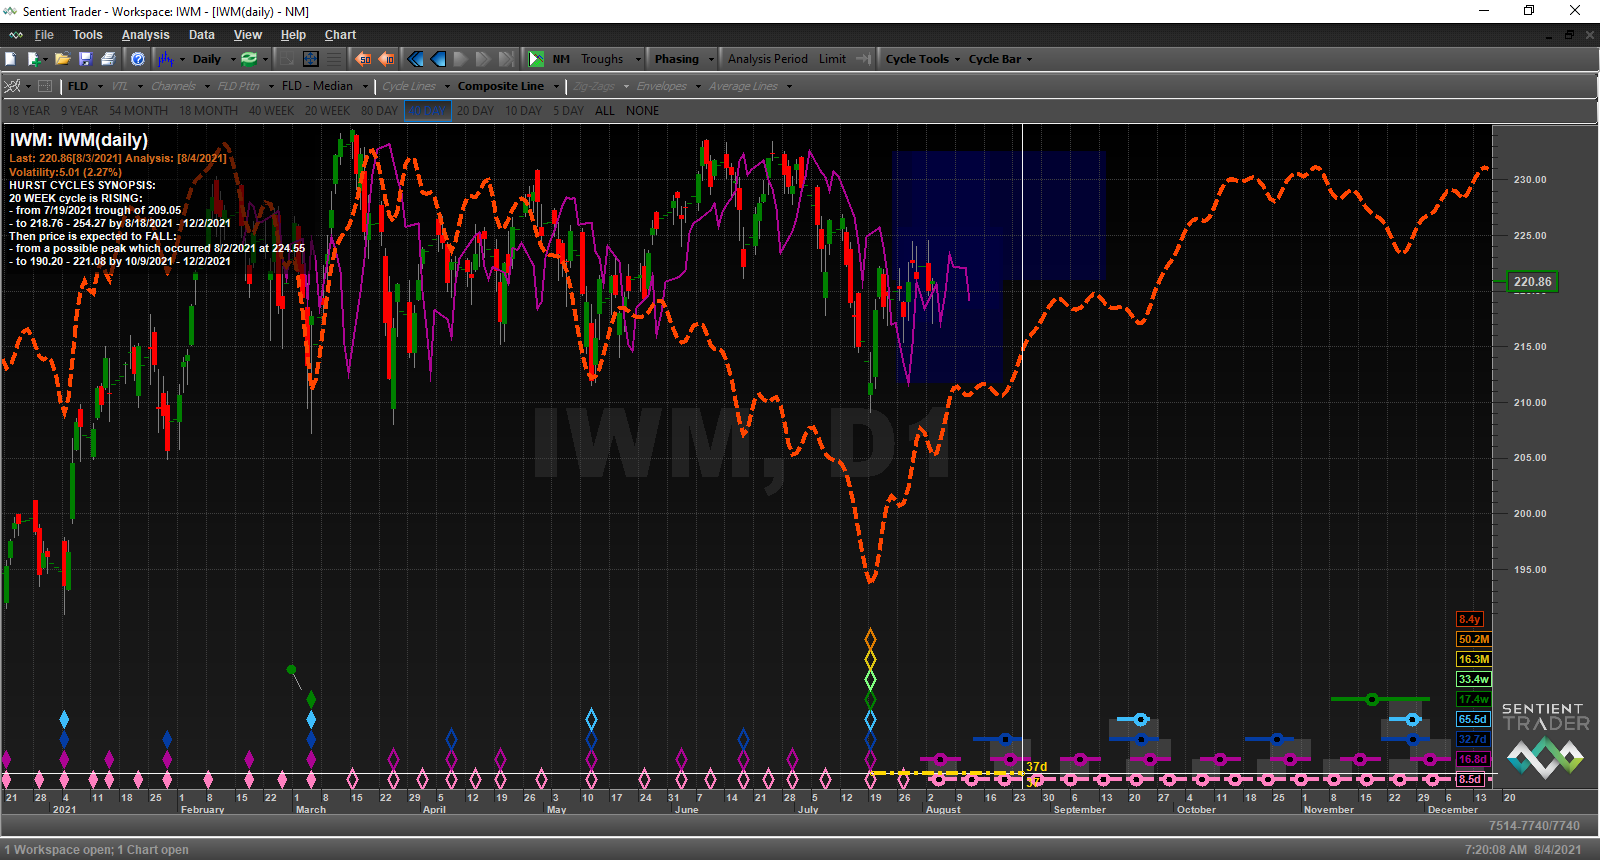
IWM – here we see price actions trapped in the stickiness of a Pause Zone. Here’s what Sentient Trader glossary tells us about them: Consolidation patterns are patterns formed by multiple FLD’s which are moving against each other’s direction, within the same price range, and often reverse direction so that they traverse the same price range several times, overlapping one another. They tend to look like a tangled mess on the chart. These consolidation patterns create Pause Zones. These are price zones in which price is likely to pause, or the development of a strong trend will hesitate.
Currently price has been moving towards the 20d FLD as it forms its 20d cycle trough. Note price has found support from the 20d FLD by my count three times. I expect price to begin the process of moving up to its 20d FLD target of 228.69 in the very near future.
In this analysis Sentient Trader, due to the limited amount of data it has to analyze with, is indicating that the July 19th trough was of 54month magnitude. I do not agree with that placement. On the RUT chart below the 54m trough, is placed at the March 2020 low.

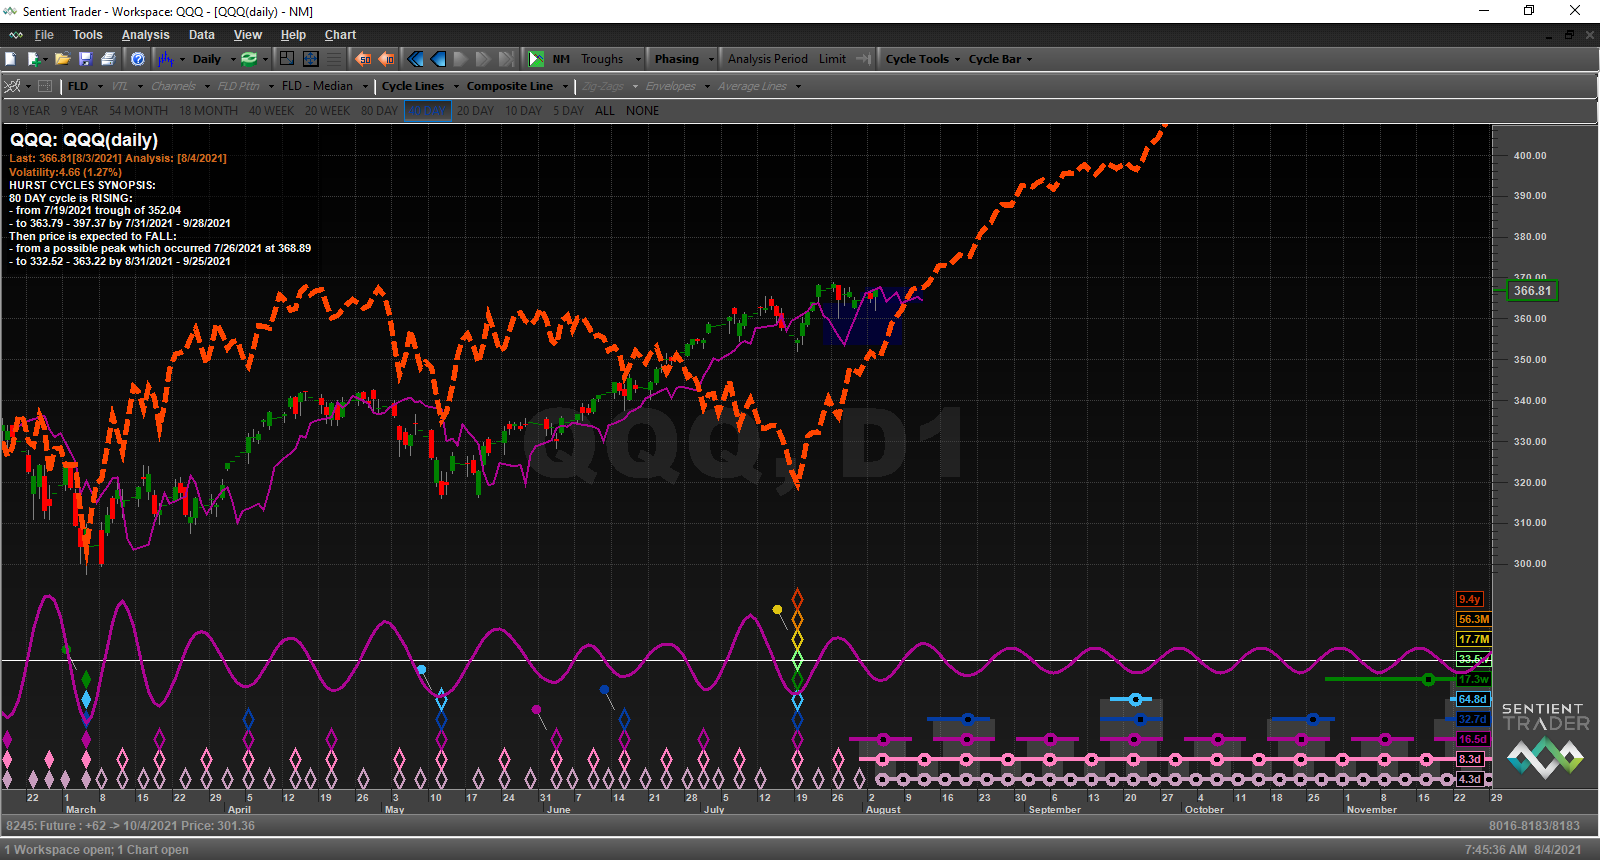
QQQ – once again we see price tracking along it’s 20d FLD while stuck in a Pause Zone. The upside target for the first crossing of the 20d FLD is 374.94. The 20d cycle trough is expected to form around August 5th if it hasn’t already done so. Furthermore, I don’t believe a 9-year cycle trough formed on July 19th but just an 18-month trough. ST is doing this because the amount of data it has available for developing this analysis is more limited than the one with NDX which is shown below.

SPY – like IWM price is reaching towards the 20d FLD and has been finding support at it. It too is caught in a mini-Pause Zone. The 20d cycle trough is due around August 5th. Once formed price should start moving up again to its 20d FLD price target of 450.51. Here again, I believe the July 19th trough was only 18-month duration—not 54-m as suggested by the placement of the stack of hollow diamonds.

RUT – showing the July 19th trough just being one of 18-month magnitude.

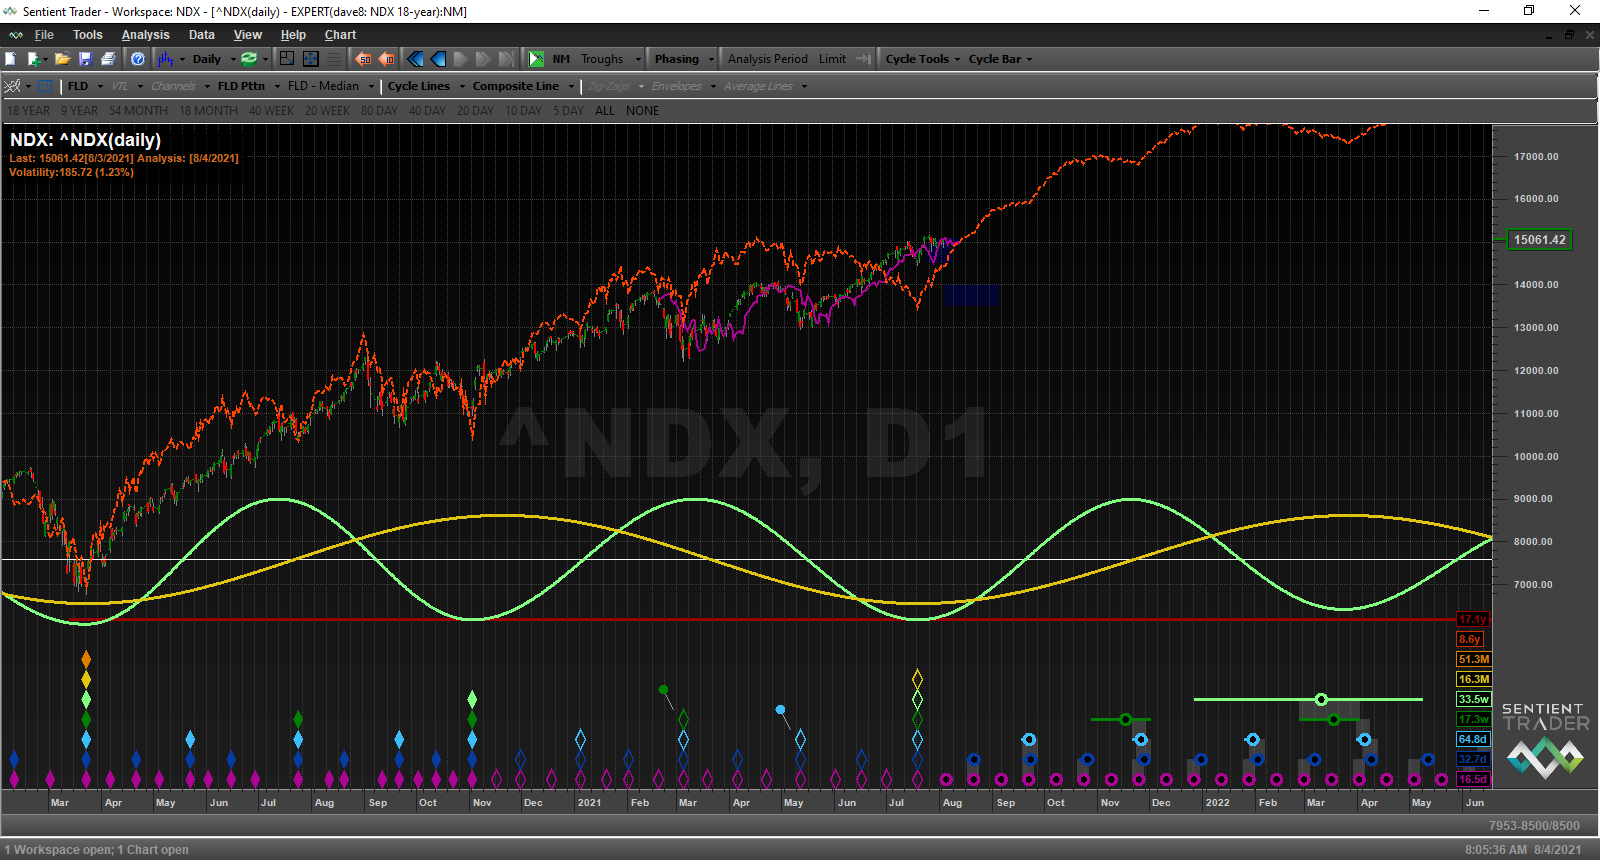
NDX – showing the July 19th trough just being one of 18-month magnitude.

SPX – showing the July 19th trough just being one of 18-month magnitude.
