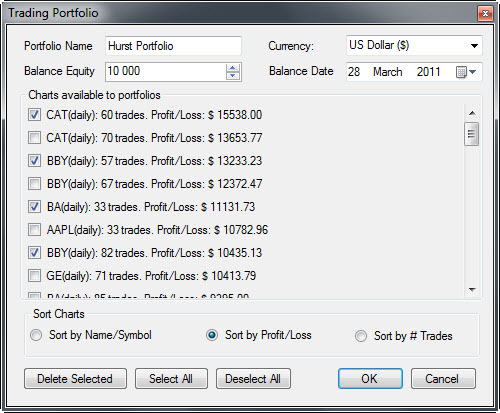

In order to see the results of trading a portfolio of instruments you must first create the portfolio, which means that you tell Sentient Trader which instruments (in the form of charts with trading histories) you want to include in the portfolio.
You do this with the menu Portfolio Manager > Create new portfolio.

Sentient Trader will present you with a window which lists all the charts that are visible to the Portfolio Manager. Not all charts are visible to the Portfolio Manager, in fact by default a chart is not visible. This is because you might work with many charts as you explore the cyclic nature of the instruments, and test the trading of different cycles, and nominal models. If all of these charts were visible to the Portfolio Manager things might become confusing.

You should name the portfolio anything you like, but obviously it should be a name that makes some sense and allows you to distinguish portfolios from one another.
Each chart in a portfolio has a trading history that has been built on the basis of the Equity of that chart, in that each trade's size (number of shares/lots/contracts) is determined by the amount of equity that can be risked on the trade. For instance if the chart's trading settings specify that the percentage of equity that should be risked is 2% then the number of shares/lots/contracts that are bought or sold is determined by the difference between the entry price and the stoploss price, which is the theoretical risk of the trade (the amount that would be lost if the trade turns out to be a losing one).
That is all very well when considering a single instrument, but when building a portfolio of instruments Sentient Trader needs to know what the equity is of the portfolio. This figure is usually the same as the equity of a chart, because when placing a trade one calculates the trade size on the basis of risking a percentage of total equity, which means of course the total equity of the portfolio.
And so what is the Balance Equity? The Balance Equity is simply the total value of the portfolio on a specific date, which is the Balance Date.
Usually this is the same figure is that used for all the charts' equity at the start of trading (before any trading takes place). And the date is a date before any of the charts started trading.
If you are tracking a real portfolio then the balance equity might well be the equity of your trading account as given on the last statement received from your brokers. In this case the balance date would be the date of the statement.
The currency of a portfolio can be specified. Note that the trading histories of all charts in the portfolio are assumed to be in the same currency.
The instruments in a portfolio are represented by charts. Note that it is quite possible to include the same instrument several times, if for instance one has several charts of the same instrument, which one might do if each chart was trading a different cycle, or trading with different settings. Therefore it is easier to think about including charts in a portfolio.
Charts in the Portfolio creation window can be sorted according to:
If you want to include a chart in the portfolio simply check the box next to the chart's details.
Click on the OK button and the portfolio will be created. Now you will want to view the Portfolio Report.