Back to contents page
The Trading Situation
A great deal of trading information is presented directly on as Sentient Trader
chart. This information can be shown or hidden by clicking on the Trading
button
in the toolbar. This is a toggle button, and when Trades are being shown on the
chart the button's text is bold.

In order to understand the trading situation of a chart, you should understand the
basic concepts of what a trade is.
There are three different types of trading information presented on a chart:
Action Signals
Action Signals are generated by Sentient Trader
as an intermediate step between a phasing analysis and the generation of trading
orders. An Action Signal can be seen as the trading decision which results from
a phasing analysis, and takes the form of a statement, such as:
If price rises above the 20-day FLD (that is the signal) then I
will enter a long trade by buying shares in this stock (the buying is the action).
Action Signals are presented on a chart:
- by means of orange dashed lines (the color of the line
can be changed in your Options)
- the line is plotted at the level of the signal (a signal is always triggered at a particular price level)
- the type of action is written above the line close to the right
edge of the chart. These are all possible actions:
- Buy immediately, presented as buy (imm)
- Sell immediately, presented as sell (imm)
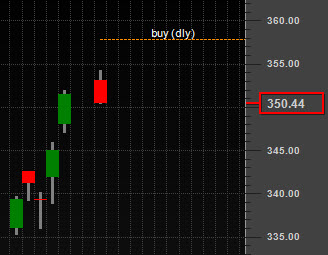
- Buy delayed, presented as buy (dly)
- Sell delayed, presented as sell (dly)
- Stoploss exit from a long trade, presented as long SL (imm)
- Stoploss exit from a short trade, presented as short SL (imm)
- Take Profit exit from a long trade, presented as long TP (imm)
- Take Profit exit from a short trade, presented as short TP (imm)
- Immediate exit from a long trade, presented as long exit (imm)
- Immediate exit from a short trade, presented as short exit (imm)
- Delayed exit from a long trade, presented as long exit (dly)
- Delayed exit from a short trade, presented as short exit (dly)
Note that an immediate Action Signal will be converted to a trade order straight
away because the action should be take immediately as price crosses the signal level.
However if you have chosen not to accept those trade orders (after an analysis is
updated, or when handling the actions compiled into a Scan Report) then there will
be no order, but the Action Signal will be plotted on the chart. Therefore one does
sometimes see immediate action signals on the chart.
Trade Orders
Trade Orders are orders that one would place with
a broker in order to enter or exit a trade. There are various
types of trade orders, and they are generated as the result of Action Signals.
Trade Orders are presented on the chart:
- by means of:
- green lines to represent buying orders, either long entries or
short exits (the color can be changed in your Options)
- red lines to represent selling orders, either short entries or
long exits (the color can be changed in your Options)
- these lines are:
- dotted in the case of entry orders
- dashed in the case of exit orders
- the line is plotted at the price level of the order
- the type of order is written above the line close to the right
edge of the chart. These are all possible order types:
- Buy to enter a long trade, presented as buy
- Sell to enter a short trade, presented as sell
- Stoploss exit from a long trade, presented as long SL
- Stoploss exit from a short trade, presented as short SL
- Take Profit exit from a long trade, presented as long TP
- Take Profit exit from a short trade, presented as short TP
- Other exit from a long trade, presented as long exit
- Other exit from a short trade, presented as short exit
Trades
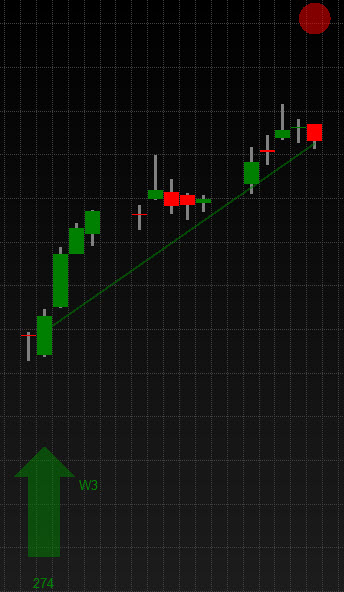
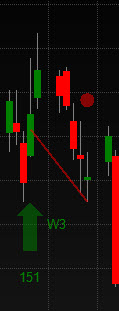
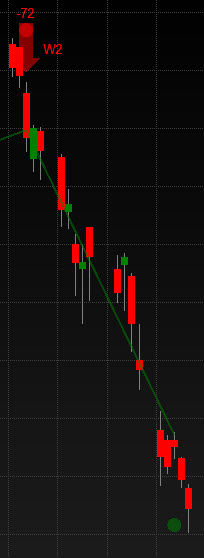
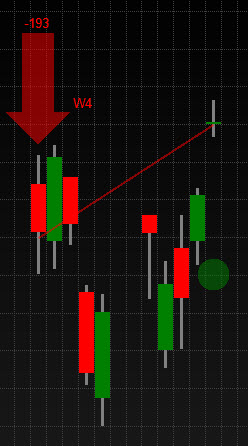
Trades are represented on a Sentient Trader chart as follows:
- The entry bar is marked with an arrow:
- an upward pointing green (the color can be changed in your Options) arrow indicates
a long entry, or buying point, plotted below the bar on which the entry occurred.
- an downward pointing red (the color can be changed in your Options) arrow indicates
a short entry, or selling point, plotted above the bar on which the entry occurred.
- Above (in the case of a short entry) or below (in the case of a long entry) the
arrow is written a number, which represents the number of shares/lots/contracts
that were bought or sold.
- If the Sentient Trading Methodolgy is being used then the Wave number
of the trade
is presented to the right of the arrow (W1, W2, W3 or W4)
- The exit bar is marked with a circle:
- a green (the color can be changed in your Options) circle plotted below the exit
bar indicates a short exit (which is of course a buying action).
- a red (the color can be changed in your Options) circle plotted above the exit bar
indicates a long exit (which is of course a selling action).
- The Trade Line is a line that connects the trade entry with the trade exit (or last
close if the trade is still open).
- the line is green if the trade is a profitable one.
- the line is red is the trade is a losing one.
- If a trade is open:
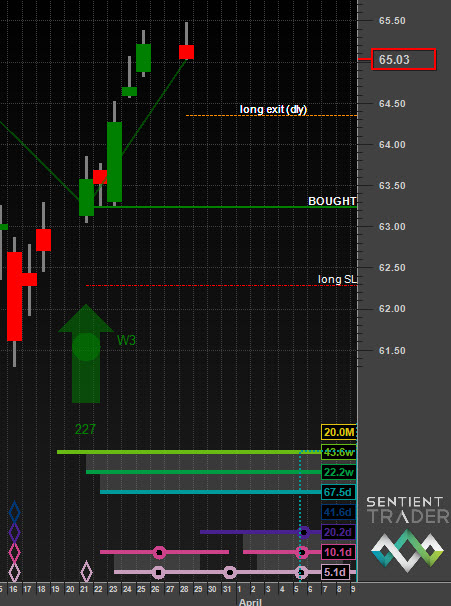
- the entry level is indicated with a thick green (in the case of a long entry) or
red (in the case of a short entry) line at the level of the entry, plotted from
the entry bar to the price scale.
- the word "BOUGHT" or "SOLD" is written above the entry line next to the price scale.
Examples
A profitable long trade:
A losing long trade:
A profitable short trade:
A losing short trade:
A delayed buy action signal:
An open trade with a stoploss exit order and a delayed exit action signal (note
that the entry was a reversal entry, in other words a short trade
was closed and a new long trade opened):
Getting Started Roadmap for EOD Trial


