The FLD Trading Strategy Course
We launched the FLD Trading Strategy Training Course in October 2012. It has been a great success and very popular with traders who are now applying Hurst Cycles to their trading using the FLD Trading Strategy. The training course consists of:
- 6 Training Modules of 72 training videos, all hosted by David Hickson, creator of Sentient Trader and published in the Hurst Cycles Trading Academy
Plus, from November 2012 until July 2013 (when we took our 2013 summer break):
- Every Monday, David posted a Hurst Trading Room Video that …
- Identified upcoming trading opportunities for the week ahead,
- And followed the progress of each open trade.
The archive of Trading Room Videos is available to students on the FLD Trading Strategy Training Course, giving them a valuable insight to using the FLD Trading Strategy in real market conditions during the eight month period.
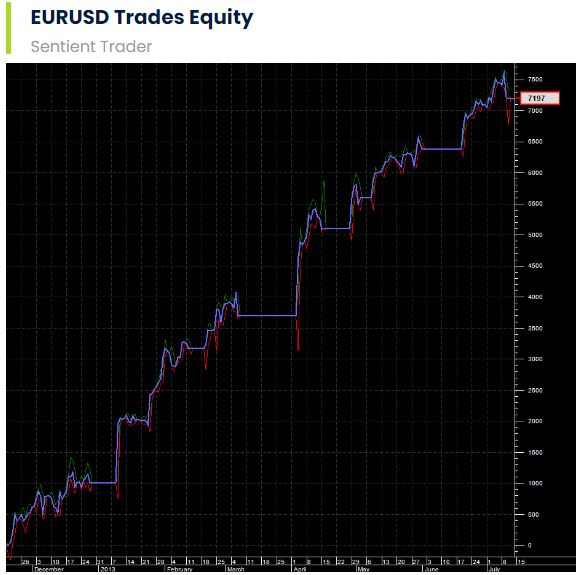
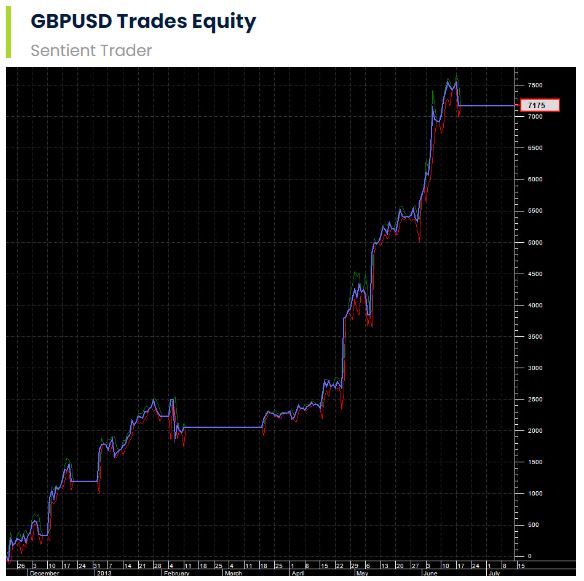
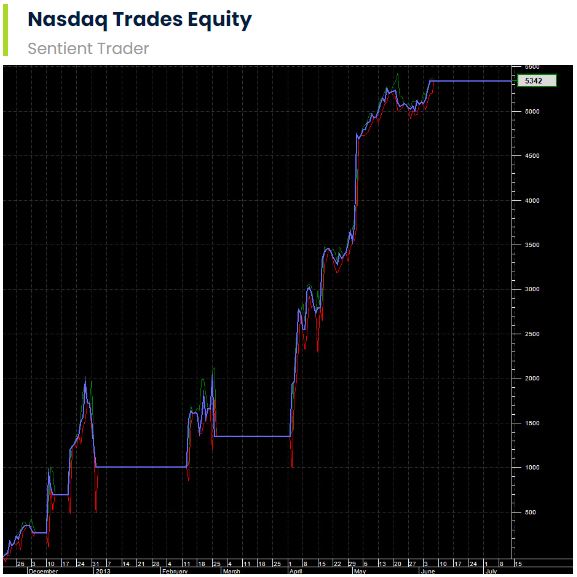
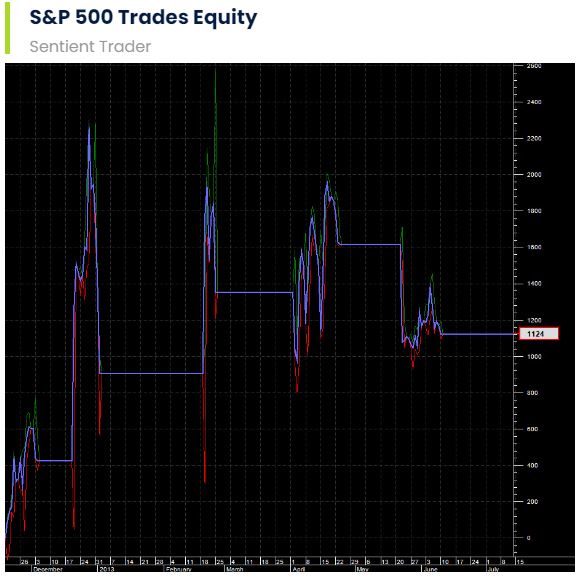
For the four core instruments in the portfolio (EURUSD, GBPUSD, NASDAQ and S&P500) we show to the right the equity graphs for the eight month period.
From November 2012 to July 2013, the Portfolio of four instruments achieved an Annualized Growth of 34% per annum with a Maximum Drawdown of 3%.
Please bear in mind that these were hypothetical trades, and that every traders results will differ.
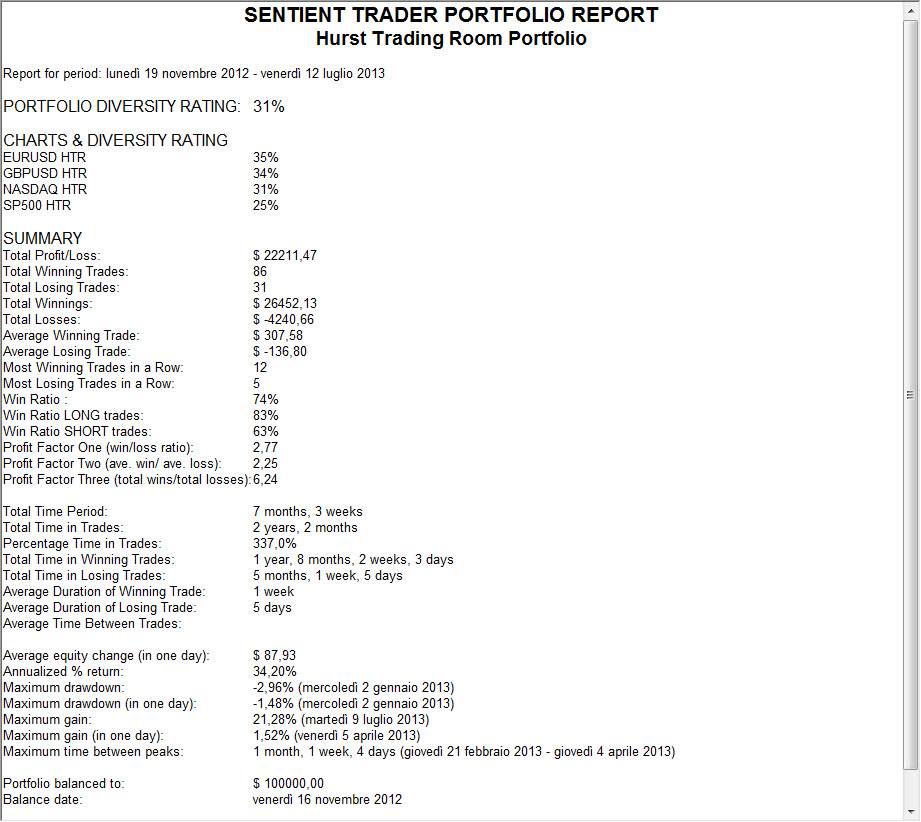
Portfolio Trading Report
The Portfolio Report is generated by Sentient Trader and provides useful measures of portfolio performance.
**Please bear in mind that these were hypothetical trades and that real results would vary
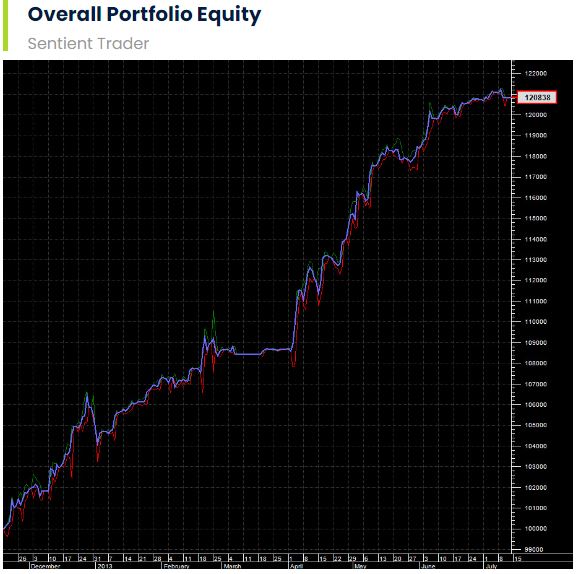
Portfolio Growth – November 2012 to July 2013
In this video, David Hickson, creator of Sentient Trader, discusses the performance of the portfolio of four instruments (including why the S&P 500 didn’t do so well in this period) and explores opportunities for achieving bigger trading returns.
Closing Trades
Click here to download the Closed Trades for the four instruments during the period from November 2012 to July 2013.