You will come across specific terms in these notes (FLD, VTL, and so on). Rather than explain them each time, you will find definitions here: guidance notes for Hurst cycles terminology
Shanghai Composite – broadly still falling towards an 18 month cycle trough, but 20 week cycle trough at hand near term.
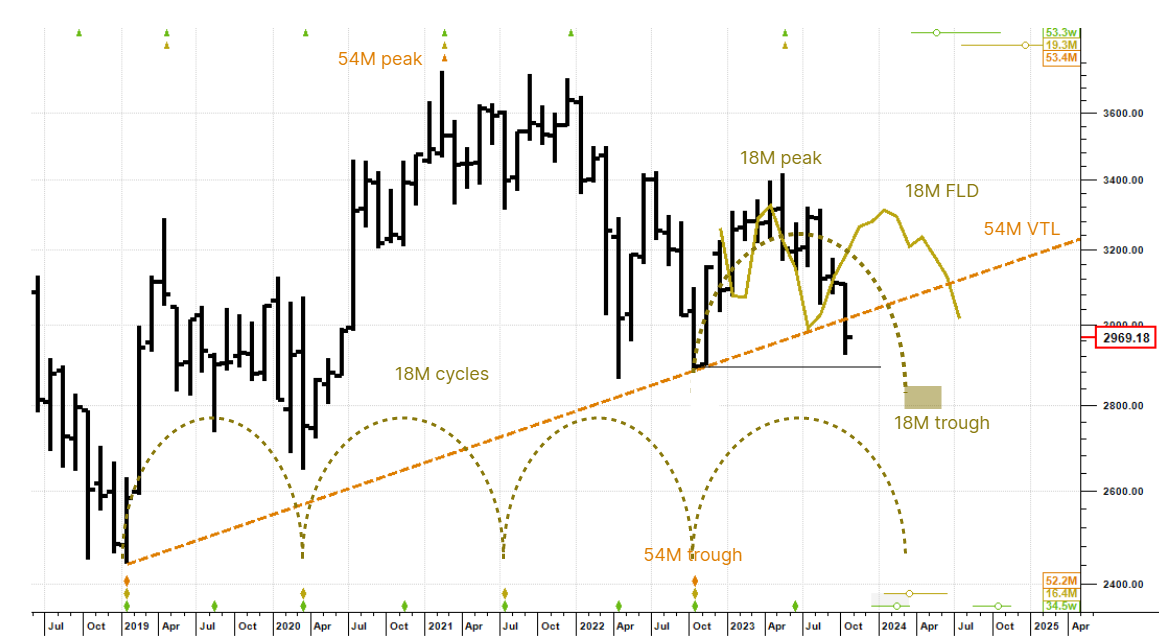
Monthly chart. The long term chart shows clean 18 month cycles, with the last trough corresponding to the 54 month cycle trough in early October. The next 18 month cycle trough is due from February 2024 and the 18 month FLD down cross in August projects to 2,837. The broad takeaway here is that longer term the market is still heavy, which points to shorter cycles peaking early and troughing late with longer, more aggressive downswings than upswings.
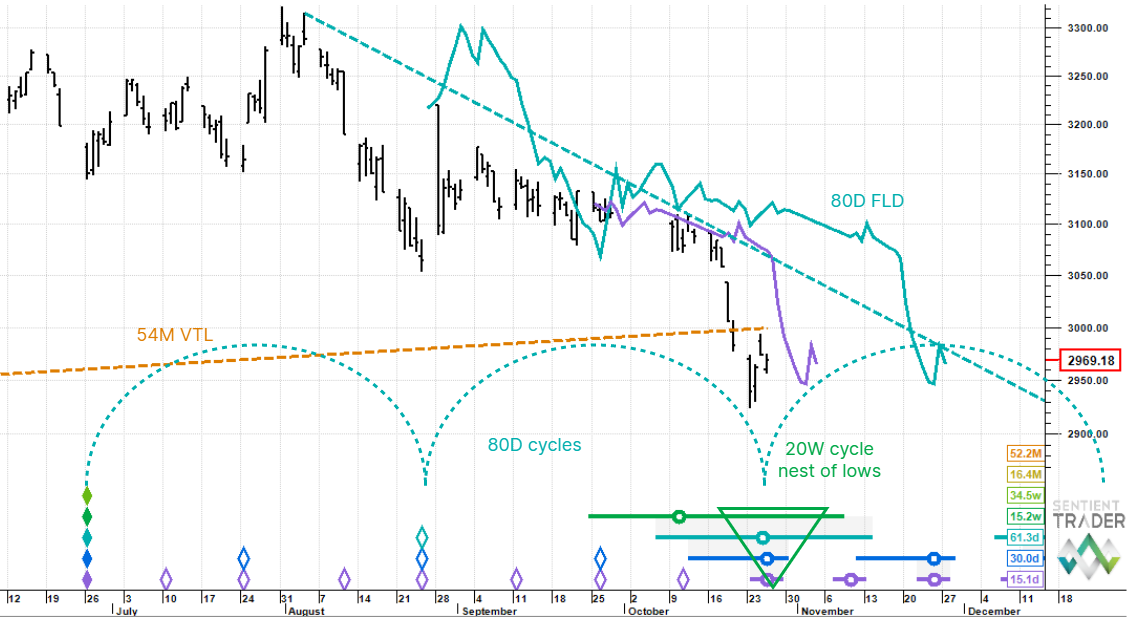
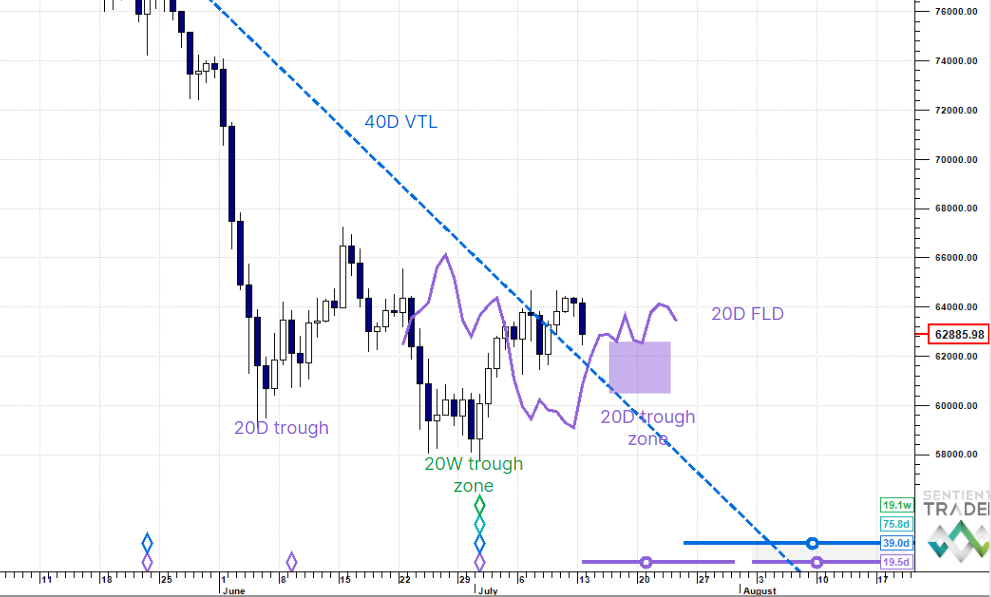
Daily chart. We see clean 80 day cycles and price testing a 20 week cycle trough zone here. This suggests that near-term downside is limited but we must await confirmation. This would come with an upside penetration of the 20 day FLD around 2,995. Because of the longer term cycles, we are not expecting a major bounce, and we will assess once it gets going.
This post was first published on Hurst Cycles Notes.