Part 3 of the Sentient Approach to trading the news Series
In our previous post about trading news events, we examined a short-impact economic report with a 20-minute “time to return.” Today, we’re scaling up dramatically to analyze a major news event with a time to return of one week and repercussions measured in months.
The same fundamental principles apply to all news events, regardless of magnitude. But when we’re dealing with major announcements, the cycles involved are much larger, and the trading opportunities extend far beyond minutes into days and weeks.
Core Principles Recap
As we dive into this major event analysis, let’s remind ourselves of the two critical insights underlying the Sentient Approach to trading news:
1. Volatility Creates Opportunity
News events cause volatility and create opportunities for price to move quickly to levels where it typically reverses (forming highs or lows).
2. Content Is Irrelevant
The actual content of news events has minimal bearing on price movement—further proof that there’s no direct cause-and-effect relationship.
Our edge comes from understanding the cycles influencing prices, not from predicting news content or market reactions.
Case Study: Major Trade Tariffs Announcement
On April 2, 2025, US President Trump was scheduled to make a major announcement regarding international trade tariffs. This was widely anticipated, with financial experts extensively debating:
- What would likely be announced
- What effect it would have on markets
- Which sectors would be impacted most
The Sentient Trader Response
As Sentient Traders, we watched with interest but ignored all the speculation. Instead, we focused on cycle analysis and prepared for what we knew would happen:
✅ Price action would be highly volatile (quick movements)
✅ Price would likely reach cycle targets and form turning points
✅ Major cycle troughs would come into play (trades measured in days, not minutes)
✅ A “time to return” would occur where price returns to pre-event levels
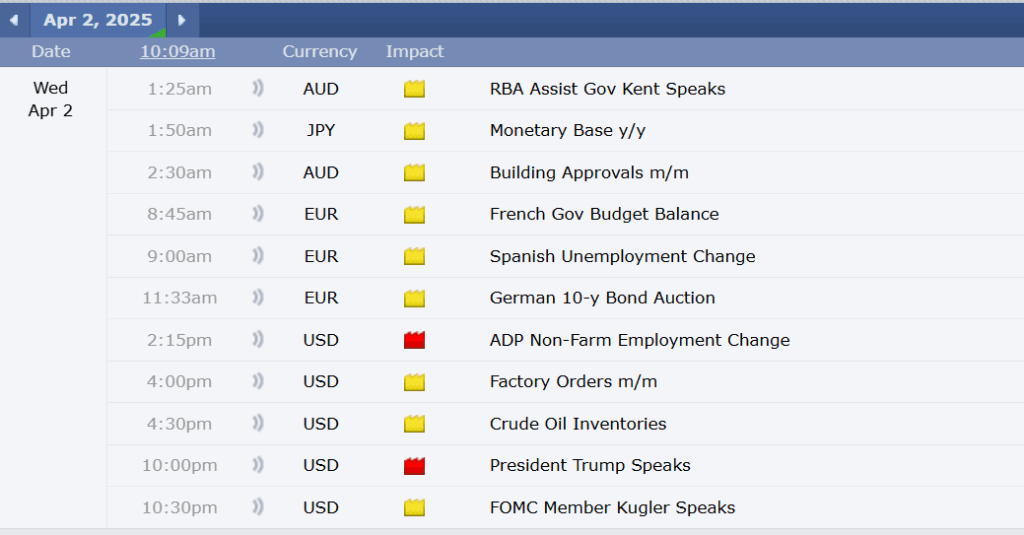
The high-impact event was scheduled for 10 PM CET (2 PM EST) on April 2, 2025.
Pre-Event Cycle Analysis
For a news event of this magnitude, we track impact using 1-hour charts (each bar represents one hour of trading). Here’s our analysis at the close of the 15:00 bar—7 hours before the announcement:
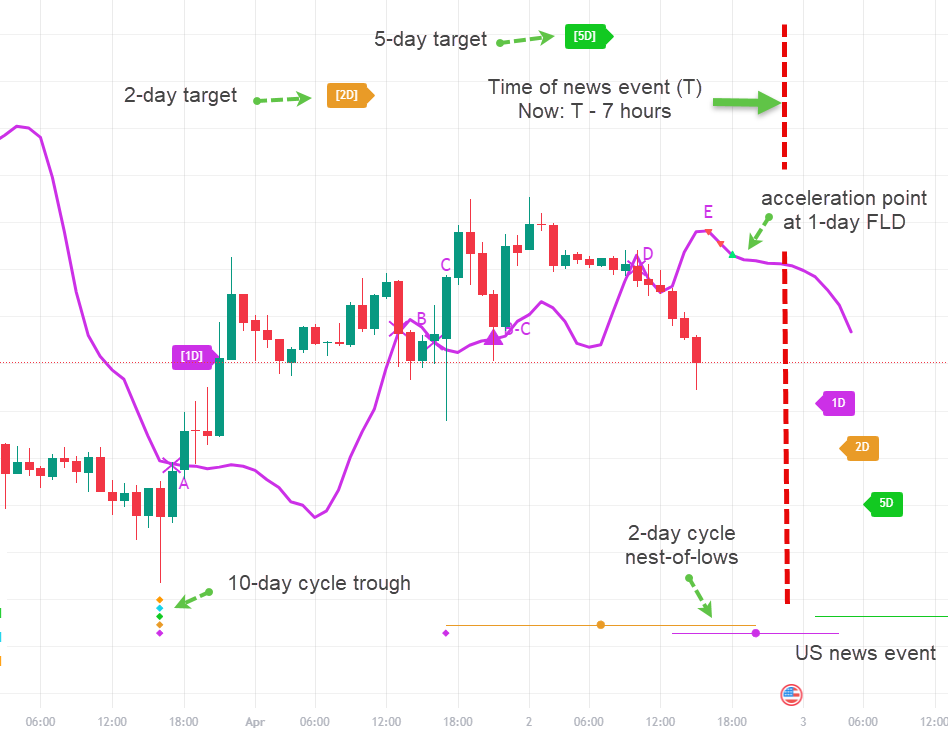
Key Cycle Observations:
Recent Cycle Activity:
- 10-day cycle trough formed two days prior (March 31 at 16:00)
- Price showing typical M-shape pattern caused by cycles
- Current pattern less bullish than expected for a 10-day bounce
Outstanding Targets:
- 2-day cycle target (orange label) above current price
- 5-day cycle target (green label) even higher
- Current 5-day cycle showing bearish characteristics
Current Position:
- 1-day cycle trough occurred at 17:00 on April 1 (middle of M-shape)
- Price approaching 2-day cycle trough (nest-of-lows structure indicates timing)
FLD Analysis:
- 1-day FLD (pink line) expecting category E interaction (an acceleration upwards)
- Red symbols turning green = acceleration point when price reaches FLD
- Expectation: 2-day trough formation, then acceleration above 1-day FLD
Timeline Prediction:
- 2-day trough expected before the news event (7 hours away)
- At news event time: likely watching for peak formation (second peak of bearish 5-day M-shape)
T-Minus 5 Hours: Pattern Confirmation
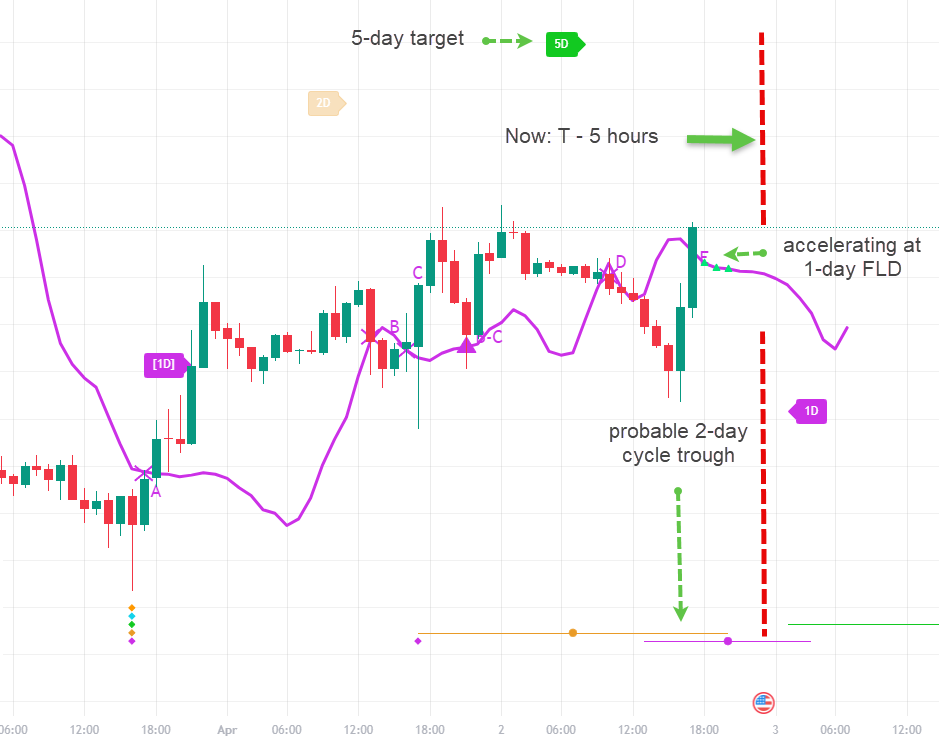
Perfect execution of our cycle prediction:
- ✅ Price crossed the 1-day FLD and accelerated as expected
- ✅ 2-day cycle trough clearly formed on the 16:00 bar
- Diamonds will replace the circles when trough confirmation is received
T-Minus 3 Hours: Target Clustering
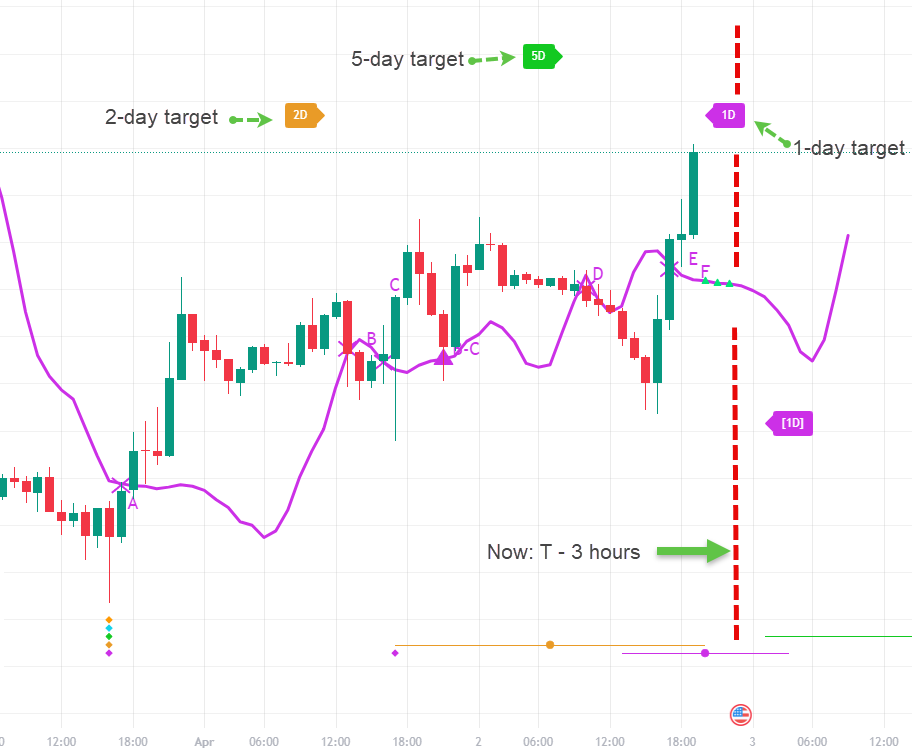
New developments in our favor:
- 1-day cycle target (pink label) now visible above price
- Target clustering: 1-day target very close to earlier 2-day target
- High probability level for price to reach
- 5-day cycle target (green label) provides additional peak possibility
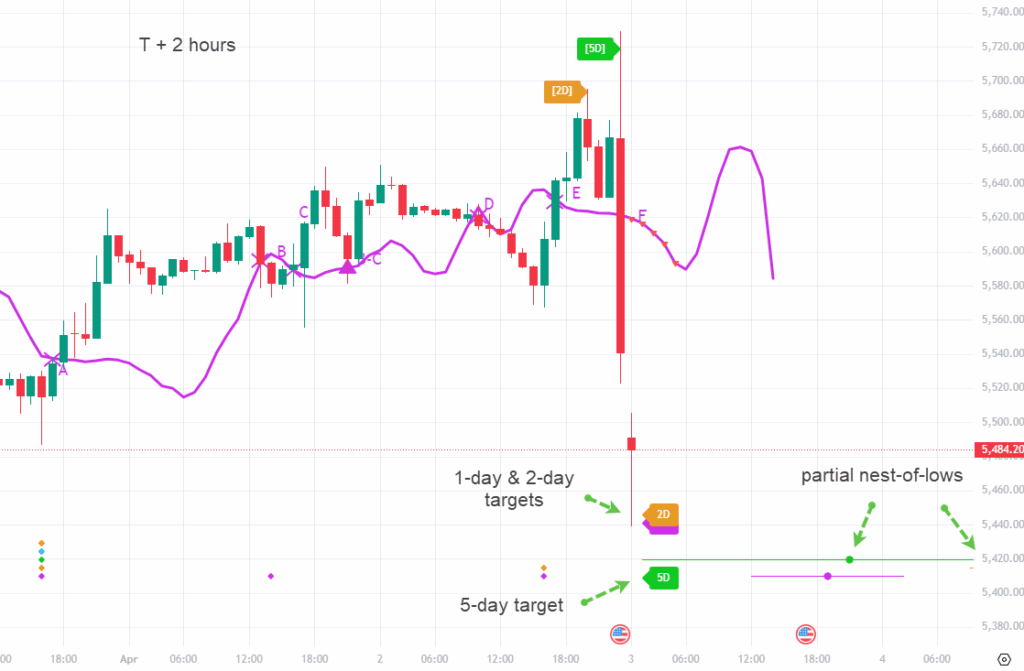
T-Minus 2 Hours: Targets Achieved

Remarkable precision of cycle analysis:
- ✅ 1-day and 2-day targets achieved (so close together only 2-day label visible)
- Price dipped slightly after hitting targets
- 1-day FLD showing new signals: F-category interaction expected (downward acceleration)
- Acceleration downward anticipated (green symbols turning red in 2 hours)
T-Minus 1 Second: The Moment of Truth
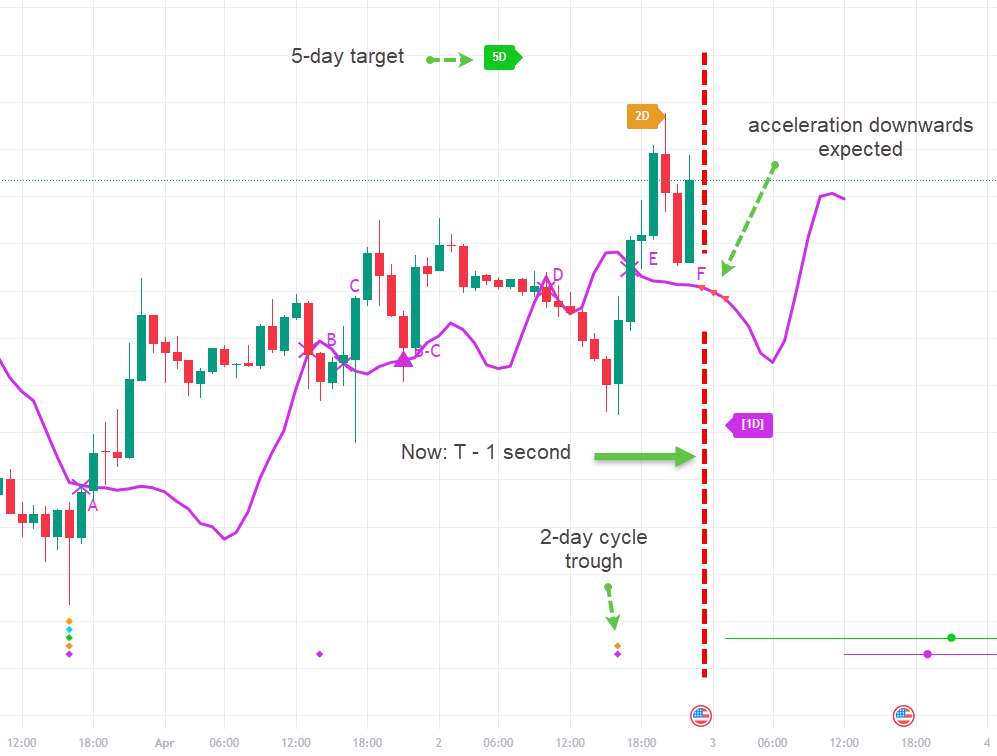
Final setup before the announcement:
- Price bouncing up as we enter the event hour
- 1-day FLD displaying red downward acceleration symbols
- F-category interaction predicted for downward acceleration
- 2-day cycle trough now confirmed with diamond markers
The Event Unfolds: Precision Timing
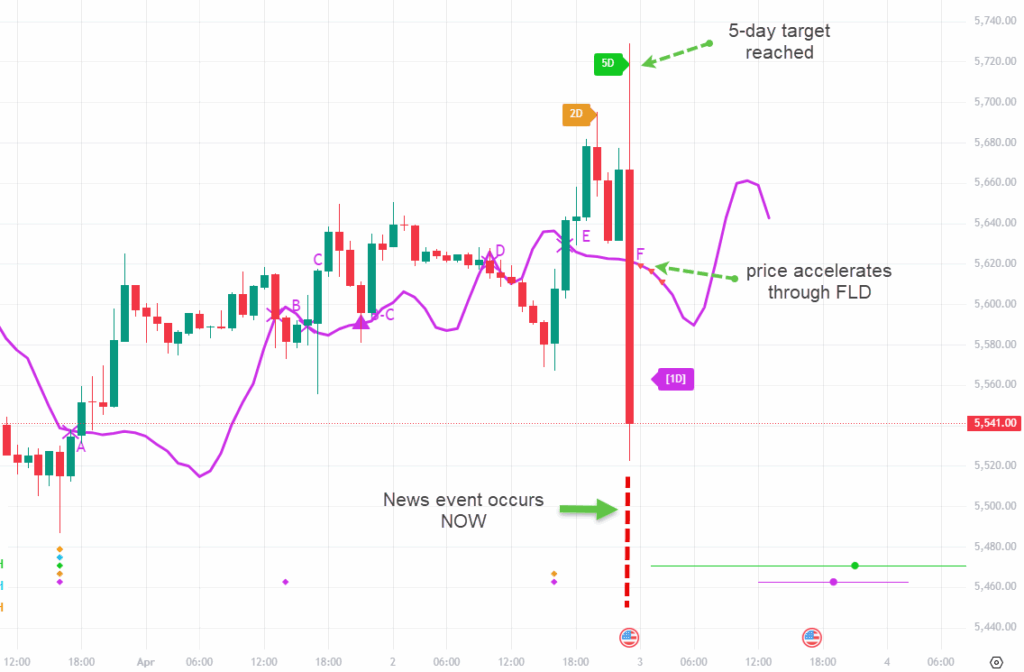
Extraordinary precision of cycle-based prediction:
✅ Before President Trump spoke a single word, the market surged up to take out the outstanding 5-day cycle target
✅ Immediate reversal after hitting the target (remember our first principle: news creates volatility and turning point opportunities)
✅ Price plunged through 1-day FLD in the expected F-category interaction
End of trading day achieved exactly as cycle analysis predicted.
Next Day: Gap Down and Continued Bearish Action
The bearish momentum continues:
- Gap down opening on April 3
- 1-day and 2-day cycle targets achieved to the downside
- 5-day cycle target still lower (more downside potential)
- 5-day cycle confirmed bearish with trough days ahead
- Plenty of scope for continued bearish price action
T+3 Hours: Failed Recovery Attempt
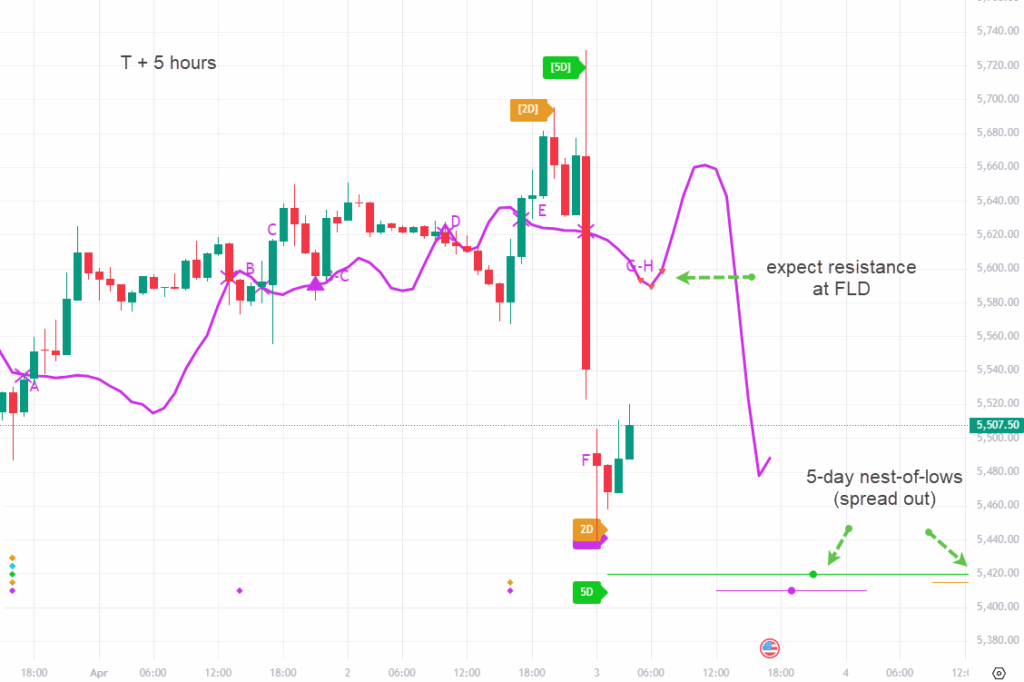
Market attempts recovery but cycle analysis predicts failure:
- Price making “gallant attempt” at recovery
- 5-day cycle trough still days away
- Next FLD interaction: G-H category pair expected (resistance)
- Resistance anticipated at 1-day FLD (red downward symbols)
- Price likely to be repelled further downward
Resistance Confirmation: Cycles Deliver Again
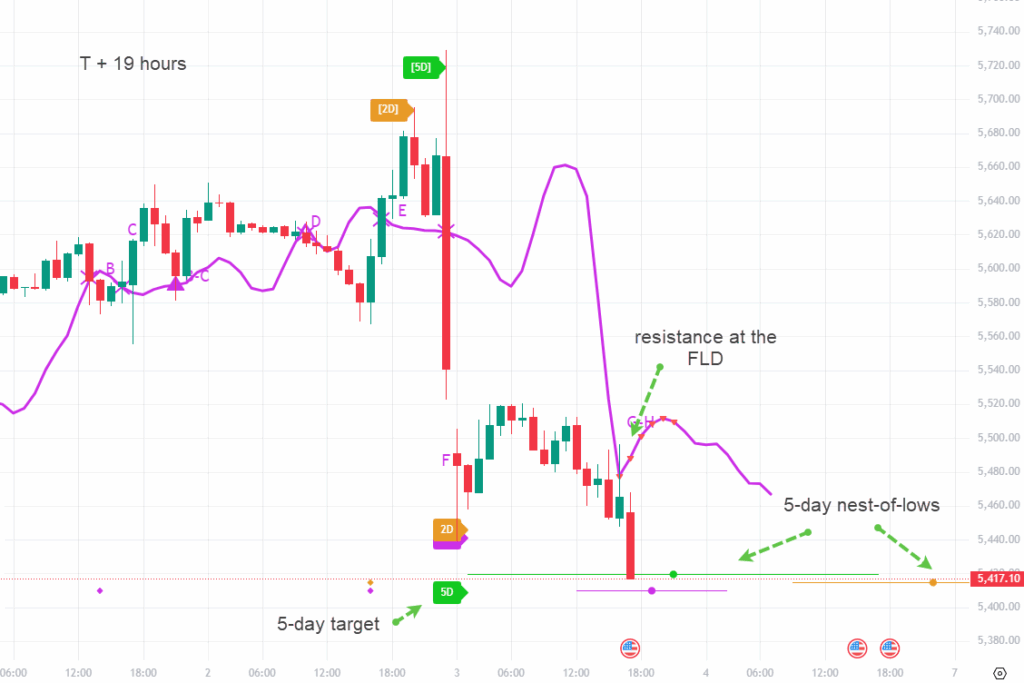
Cycle prediction proves accurate once more:
- ✅ Price found resistance at 1-day FLD as predicted
- ✅ Failed to climb above and was repelled downward
- Outstanding 5-day cycle target still below (achieved hours later)
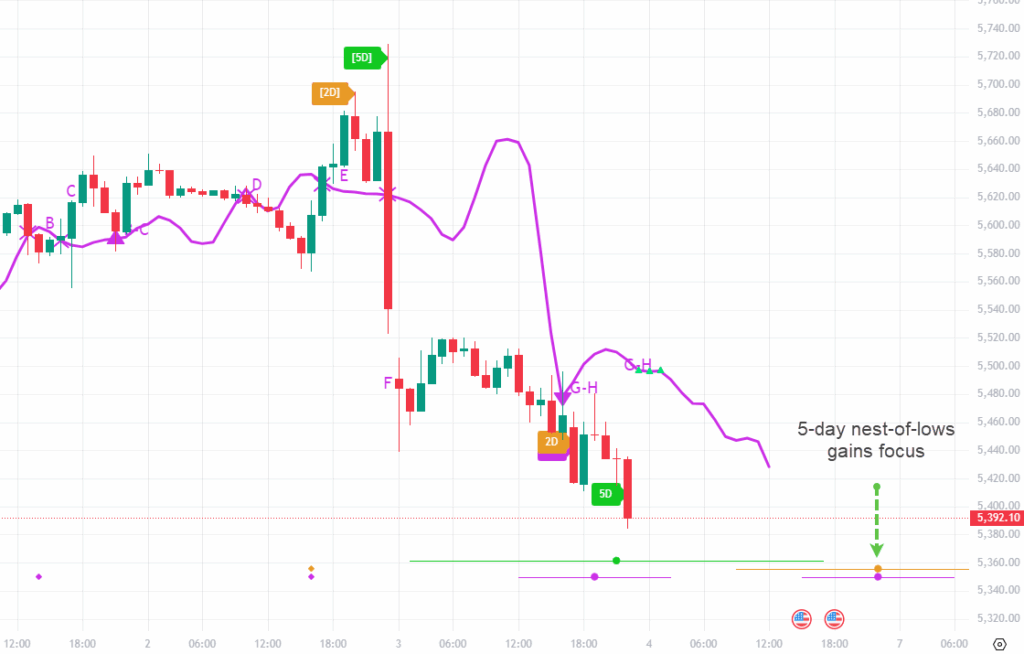
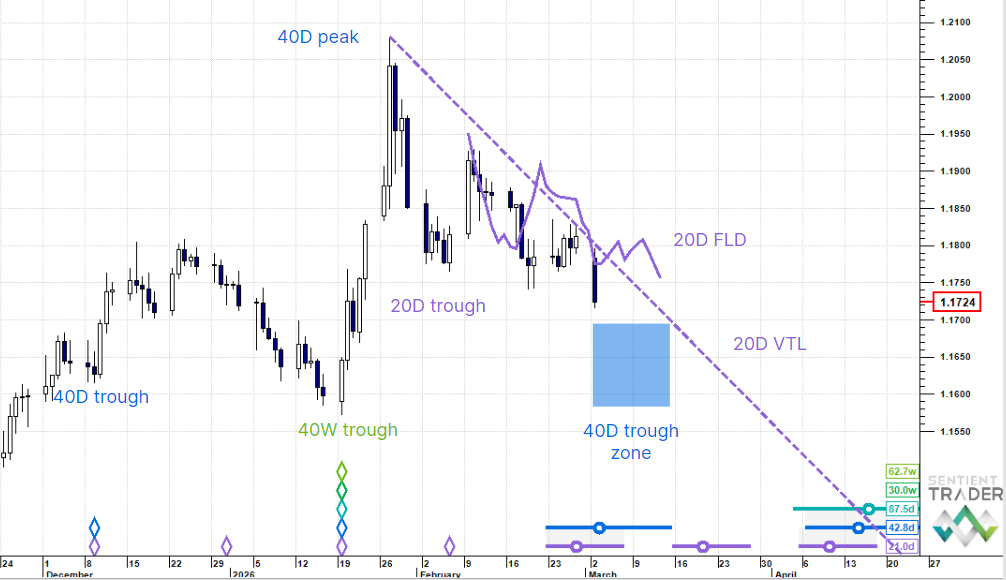
Time to Return: One Week Later
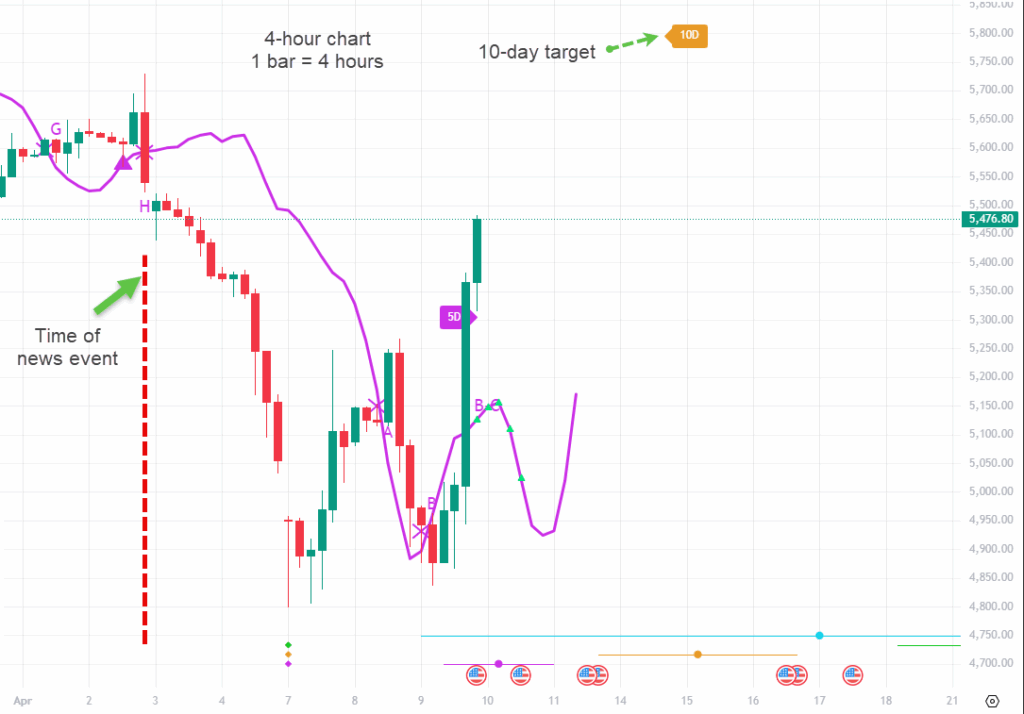
The final piece of the news event puzzle: time to return of exactly one week.
Price returned to the level where the news event occurred, completing the cycle of volatility and demonstrating once again that news events create temporary disruptions rather than lasting directional changes.
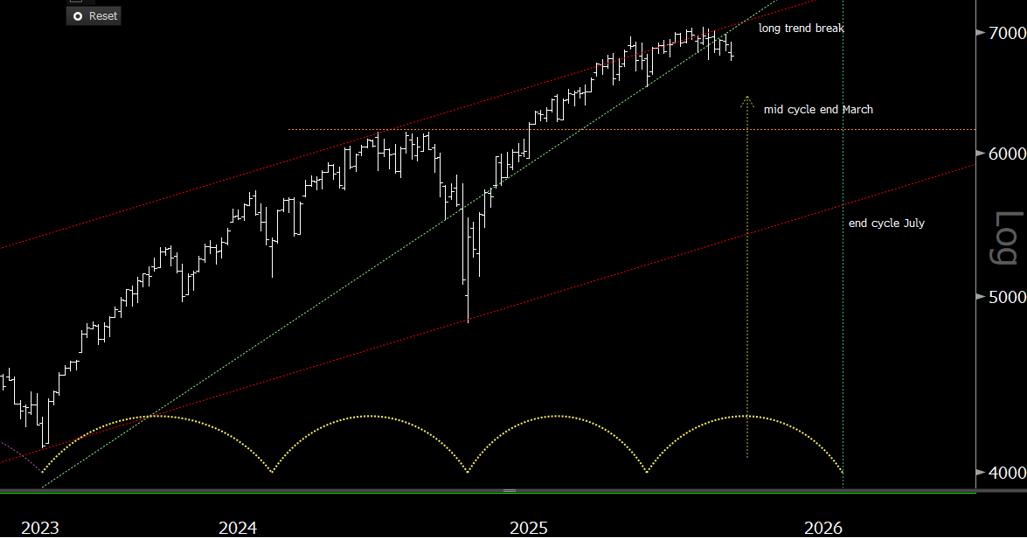
The Bigger Picture: Long-Term Cycle Impact
A Critical Formation
The strong move down followed by the bounce back formed a prominent trough that is most likely a major cycle trough—possibly 40 weeks or even 18 months in magnitude.
The Essential Question
Would this major trough have formed without the news event?
Absolutely yes.
Cycles have always influenced markets and will continue to do so. This major trough might have occurred:
- Slightly earlier or later
- In a slightly different manner
- At a marginally different level
But it would have formed regardless.
What Would Change?
The only difference would be the story the media tells about why the trough formed:
- With the news event: “Markets plunge on trade tariff fears”
- Without the news event: “Markets decline on growth concerns” or “Technical selling pressure mounts”
The cycle would be the same. Only the narrative would differ.
Key Takeaways for Different Time Horizons
For Day Traders:
- Major news events create extended volatility windows (hours, not minutes)
- Multiple cycle targets provide several trading opportunities
- FLD interactions remain highly predictive for entries and exits
For Swing Traders:
- Week-long time to return creates excellent swing trading setups
- Major cycle formations offer substantial profit potential
- Target clustering provides high-confidence exit levels
For Position Traders:
- 40-week to 18-month cycle troughs represent major turning points
- News events can accelerate cycle timing but don’t change cycle existence
- Long-term cycle analysis trumps fundamental analysis for major turns
The Sentient Advantage
While others debate tariff impacts and economic implications, Sentient Traders:
- Ignore the noise of expert predictions and media speculation
- Focus on cycle timing for precise entry and exit points
- Use news events as volatility catalysts rather than directional indicators
- Profit from predictable cycle behavior rather than unpredictable news reactions
Tools & Resources
The charts shown were captured from TradingView using the Sentient FLD indicator.
Access a free 14-day trial of the indicator here
Series Conclusion
This completes our three-part series on the Sentient Approach to trading news events:
- Part 1: The Great Market Myth – Why news doesn’t drive prices
- Part 2: Trading the News – Micro-scale events (20-minute time to return)
- Part 3: Big Impact Events – Macro-scale events (week-long time to return)
The message is consistent across all time frames: Cycles drive price action. News creates volatility. Content is irrelevant.
Master the cycles, and you master the markets—regardless of what headlines dominate tomorrow’s news.
Ready to revolutionize your approach to market analysis? The Sentient Approach provides the framework for understanding what really moves markets, beyond the noise of daily headlines and expert opinions.