Part 2 of the Sentient Approach to trading the news Series
In our previous post about news events, we dismissed the myth that price movements are caused directly by news events, economic conditions, or generally held opinions.
Yet there clearly is a relationship of sorts—good news and good economic conditions are likely to lead to rising prices. The point we made, however, is that we cannot use news events as a basis for making consistent trading decisions.
Today we’ll dive deeper into this concept by examining how news events influence markets on a micro scale—looking at “scheduled” news events over a period of minutes rather than the macro headlines we discussed previously.
What You’ll Discover
This analysis will demonstrate two critical insights:
- On the micro scale, news events create volatility and opportunities for price to move quickly to levels where it typically reverses (forming highs or lows)
- The actual content of news events has minimal bearing on price movement—further proof that there’s no direct cause-and-effect relationship
This raises an obvious question: If news content doesn’t drive prices, what does? And is there something actionable we can use for trading decisions?
The answer is yes: We can use an understanding of the cycles influencing prices to make intelligent decisions around news events.
Case Study: Core PPI Economic Report
The Core PPI economic report, issued monthly, provides an excellent example of how this works. Here’s the scheduled economic calendar for May 15, 2025:
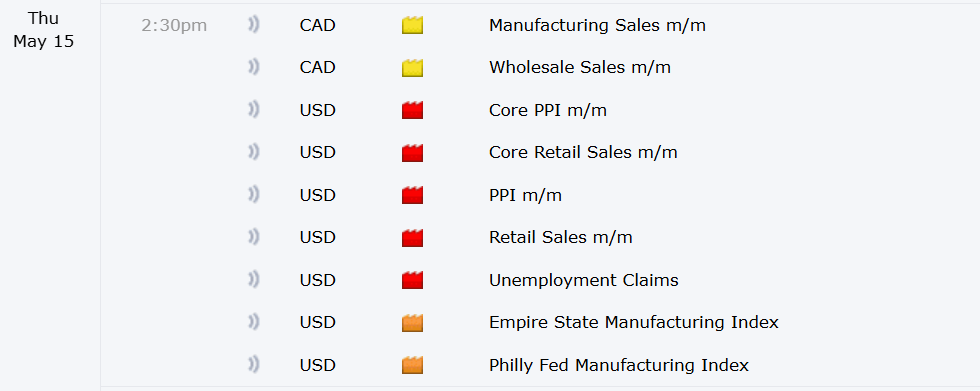
Notice the red icons: several high-impact reports all released at 2:30 PM CET (8:30 AM New York time).
The Traditional (Flawed) Approach
The conventional wisdom for trading news events follows this logic:
- Step 1: Decide whether the news will be “good” or “bad” for prices
- Step 2: Make a trade anticipating the expected price reaction
- Step 3: Hope you’re right about both the content and the market’s reaction
The Problems Are Obvious:
- Unreliable cause-and-effect relationships: Will this headline support your assumed correlation, or contradict it entirely?
- Predicting the unpredictable: Unless you can see the future with certainty, this approach is little different from betting on red at the roulette table
Attempting to trade news events based on conventional beliefs about news-price relationships is a flawed approach that leads to consistent losses.
There must be a better way.
What Really Happens: The Charts Tell the Story
Let’s examine actual price action during our Core PPI release using one-minute candlestick charts of the S&P 500.
Chart Reading Basics:
- Green bars: Price rose during that minute (bullish)
- Red bars: Price fell during that minute (bearish)
- Body: Shows opening and closing prices
- Wicks: Show the extreme high and low prices reached
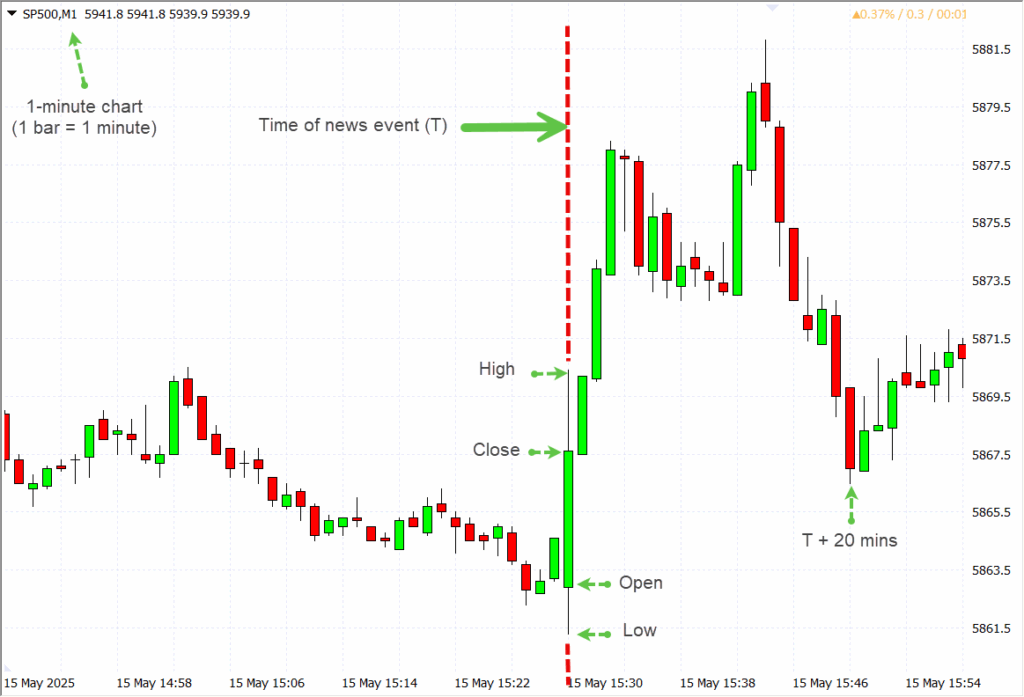
Note: Chart shows time one hour ahead of CET, so our 14:30 CET event appears at 15:30
Key Observations:
- Pre-event trend: Market was generally falling for 30 minutes before the news
- Immediate reaction: At the exact news release time, price moved down to a new low, then reversed upward with a strong bullish move
- Quick movements: Market surged up for 4 minutes, retraced for 8 minutes, surged again for 3 minutes, then fell for 7 minutes
- Time of return: Just 20 minutes after the news event, price returned to pre-event levels
The Bigger Picture
Stepping back to a five-minute chart reveals more:
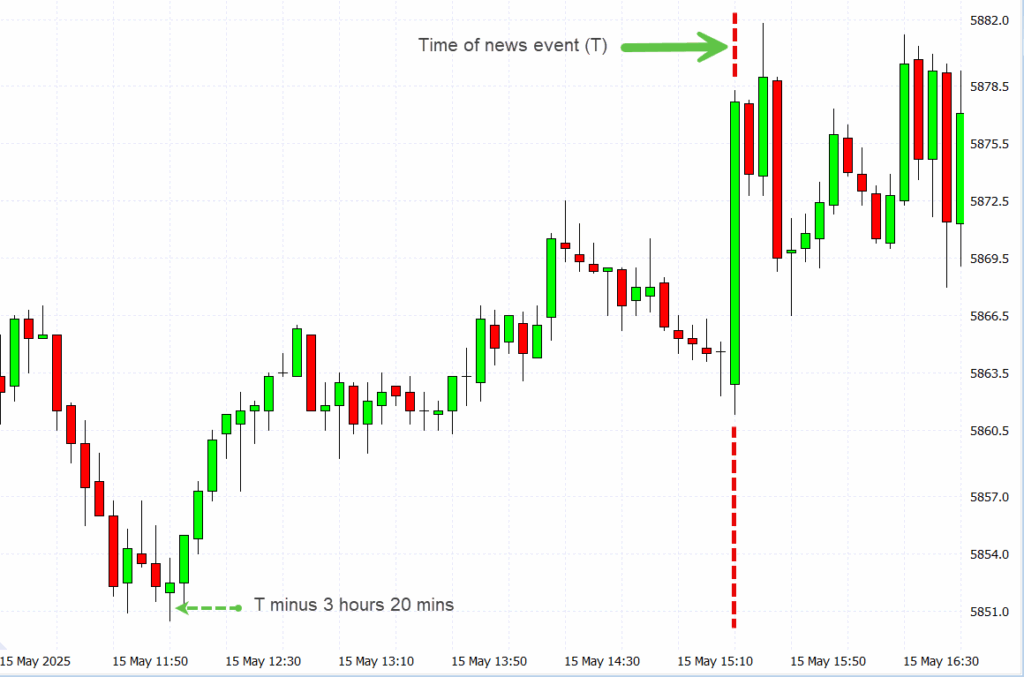
Critical Insights:
- Existing trend: The market had been rising from a low point three hours before the news event
- Pre-event pullback: Price fell for the hour leading into the announcement
- Volatility spike: The biggest range bar occurred in the first 5 minutes after the news
- Continuation: The market continued rising after the event
With this broader perspective, the news event simply provided a boost to an already rising market.
The Million-Dollar Question
Did the content of this news event directly cause the price movement?
Conventional wisdom suggests the actual figures and results are crucial. But consider this: Was the economic report received, understood, and acted upon within sixty seconds?
It seems highly unlikely.
The widespread belief that news should be traded based on anticipating both content and market reaction is fundamentally flawed.
The Sentient Approach: A Better Way
The Sentient Approach to trading news events operates on two fundamental principles:
1. Content Is Irrelevant
Price action during news events is not caused by the content. We don’t care if the news is positive or negative. The news event serves only to provide:
- Heightened volatility
- Opportunity for market reversals (formation of peaks or troughs)
2. Cycles Drive Markets
Markets are influenced by cycles, and cycle analysis allows us to anticipate price action. We follow principles outlined by J.M. Hurst over 50 years ago for this analysis.
Cycle Analysis in Action
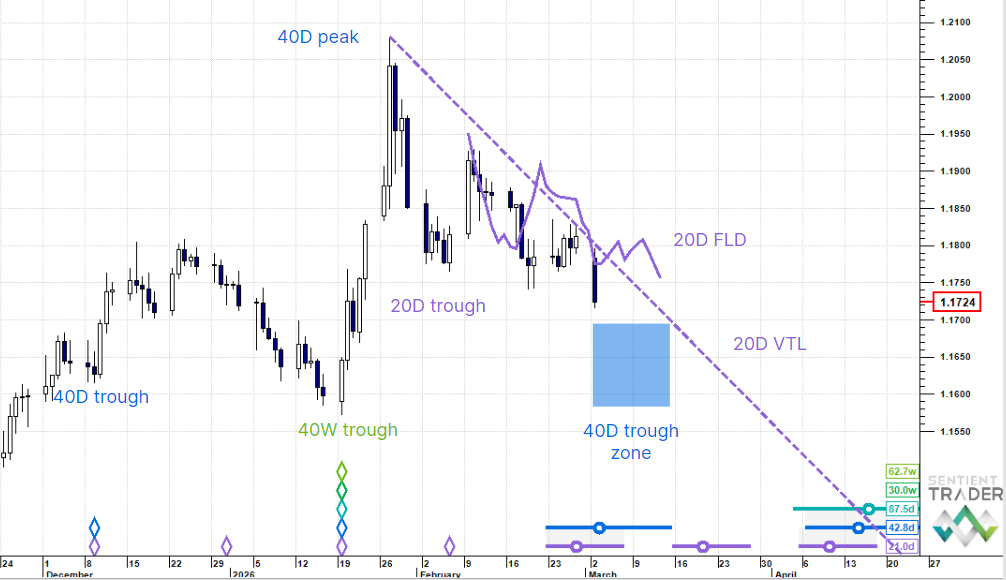
Let’s examine the same news event through the lens of a Sentient Trader, using five-minute charts. This first one taken moments before 15:25:
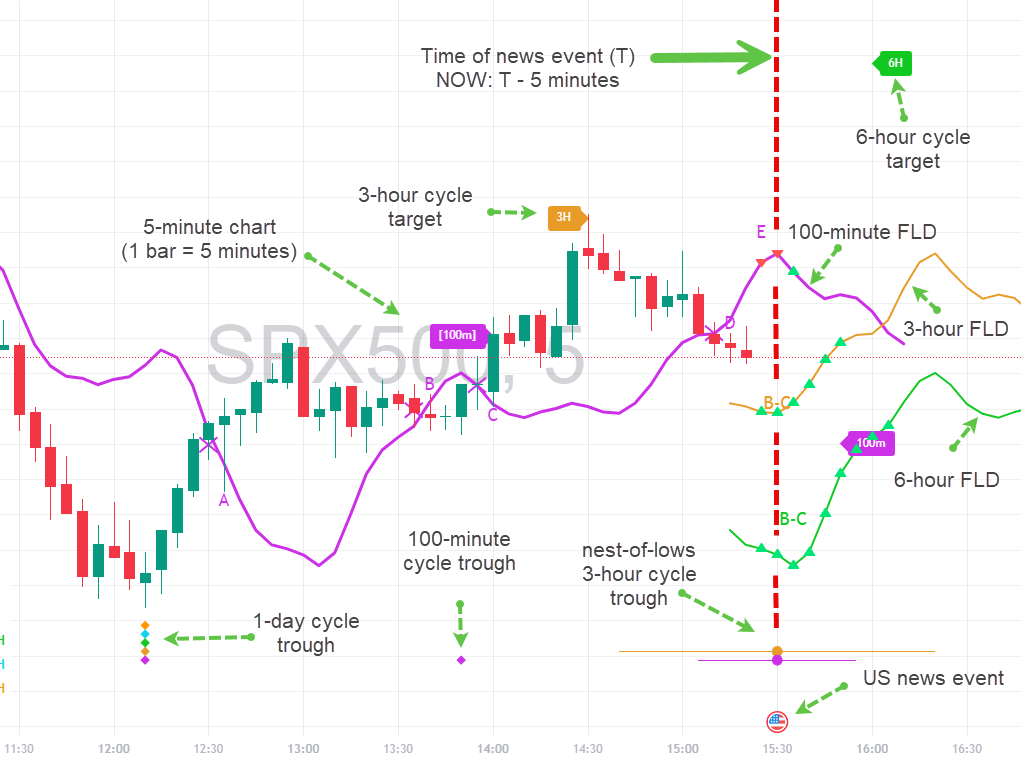
Understanding the Chart Elements:
Cycle Troughs (Diamonds):
- Stack of diamonds at 12:10 marks a 1-day cycle trough
- All shorter cycles formed lows simultaneously (Hurst’s principle of synchronicity)
- Pink diamond at 13:50: 100-minute cycle trough
- 1-day, 12-hour, and 6-hour cycles are all influencing price upward
Future Expectations (Circles-and-whiskers):
- Orange and pink circles: Expected next troughs for 3-hour and 100-minute cycles
- Combined “nest-of-lows” expected around 15:30
- US news event symbol positioned beneath these circles
Future Lines of Demarcation (FLDs):
- Pink, orange, and green lines are FLDs, which define levels where price will likely:
- Find support (if falling)
- Encounter resistance (if rising)
- Accelerate through toward targets
- Which of these three behaviors occurs depends on the cycle analysis. The cycle analysis therefore enables us to anticipate the price behavior at the level of each FLD.
Targets:
- Pink, orange, and green targets for 100-minute, 3-hour, and 6-hour cycles
- 100-minute target was achieved at 14:00
- 3-hour target reached at 14:30, causing price to turn down
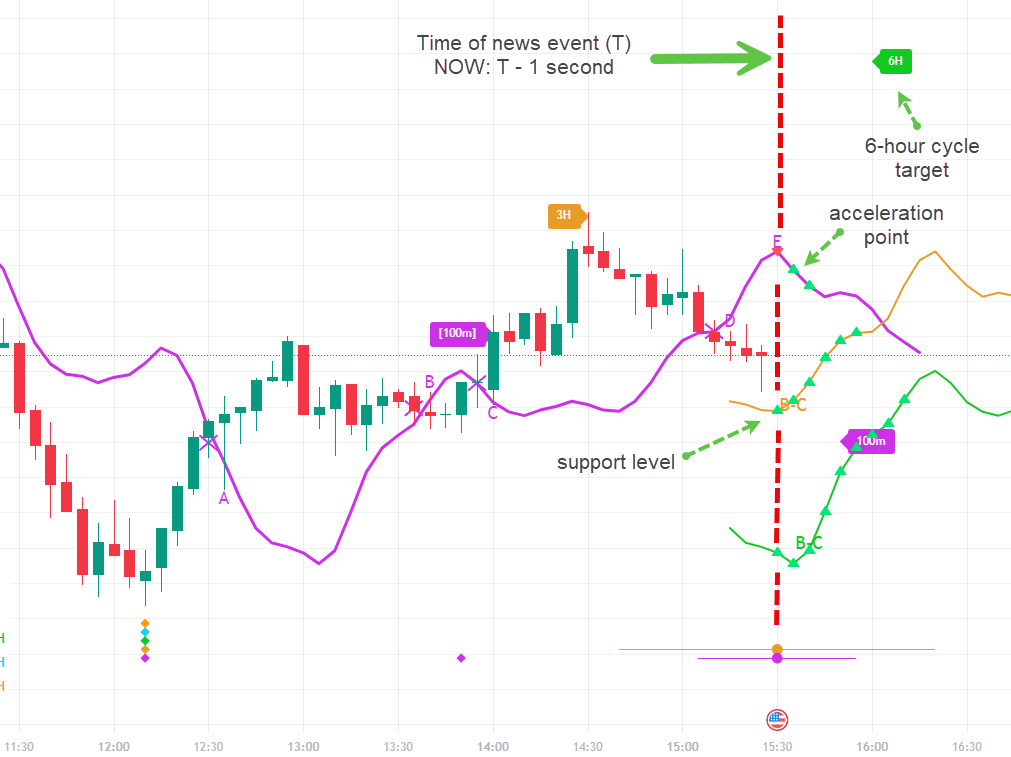
Pre-Event Analysis
Five minutes before the news event, our cycle analysis predicted:
- 3-hour cycle trough to form around 15:30
- Orange FLD (3-hour) expected to provide support
- B-C category interaction where price finds support at the orange FLD
- Acceleration through pink (100-minute) FLD as price bounces
- High probability of reaching the 6-hour cycle target
The Event Unfolds

The news event bar shows remarkable accuracy of our cycle-based prediction:
- ✅ Price came down to a new low
- ✅ Reached the orange FLD with extraordinary precision
- ✅ Found support, turned around and bounced up
- ✅ Crossed above and accelerated through the pink FLD
Target Achievement
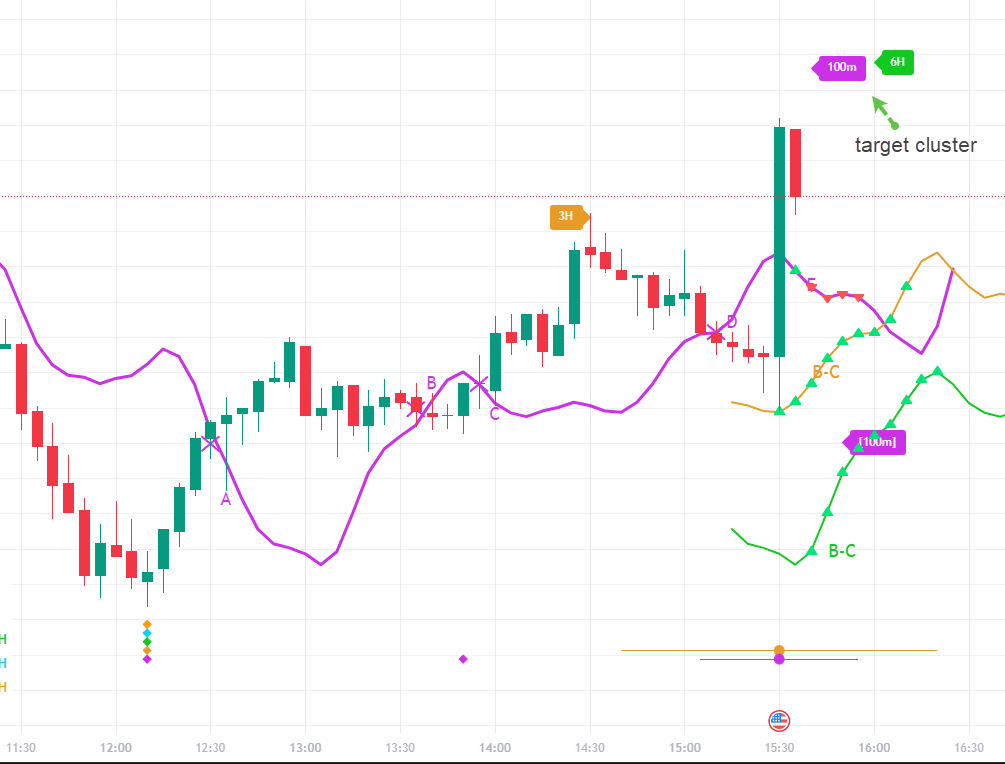
Five minutes later, price consolidates near our targets. Notice the target clustering—when multiple cycle targets align, they provide very high probability levels.
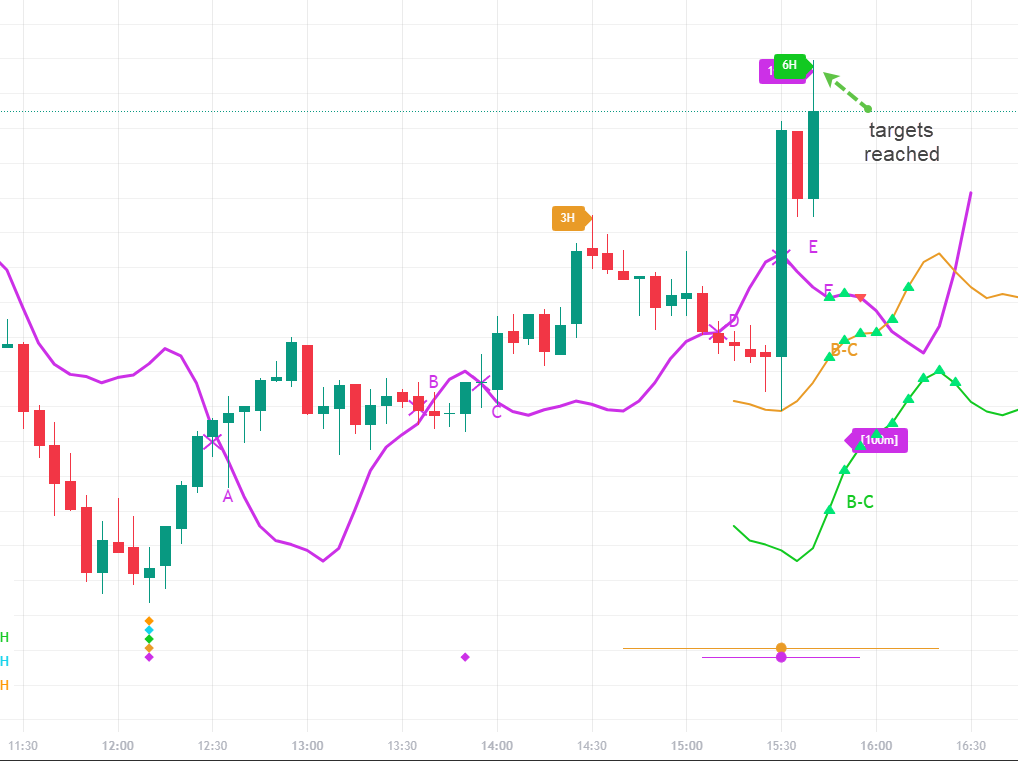
Price achieves both the 100-minute and 6-hour cycle targets—the latter target we identified before the news event occurred!
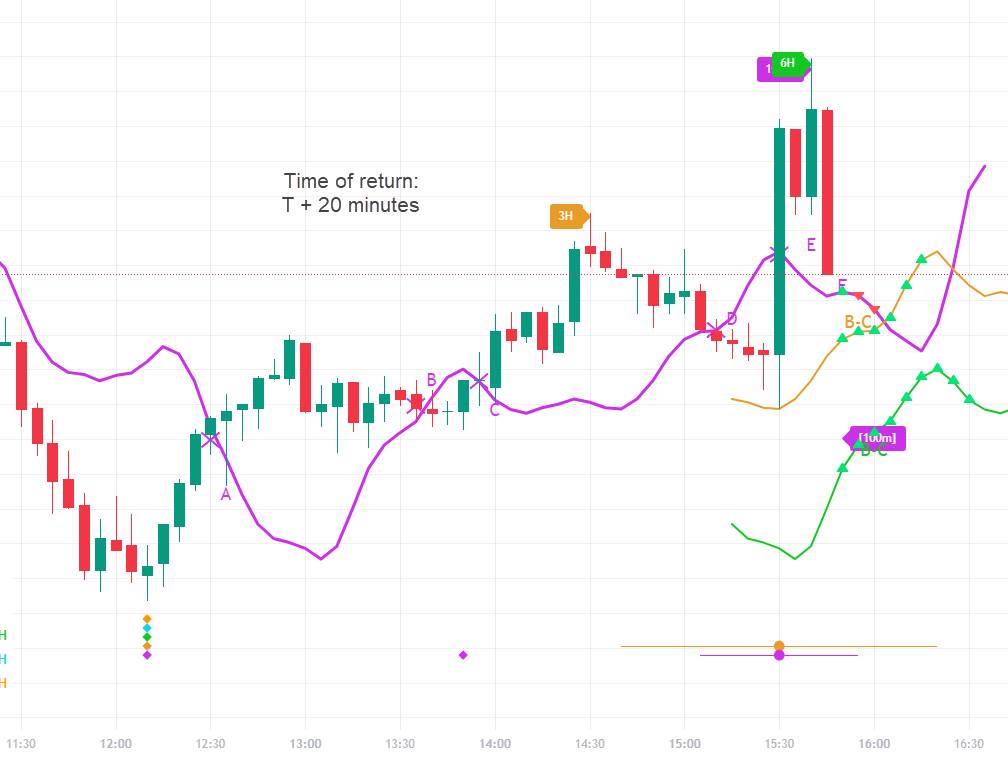
This news event had a time of return of only 20 minutes. Price returned to levels from before the event, demonstrating how news creates temporary volatility rather than lasting directional change. On most occasions price returns to the level it was at before the news event (or at a prominent level that formed shortly before the news event, such as in this case — the high price of the 15:00 bar).
The Content Reality Check
Still believe content drives price movements? Here’s the actual text of one of the five high-impact news events released simultaneously:
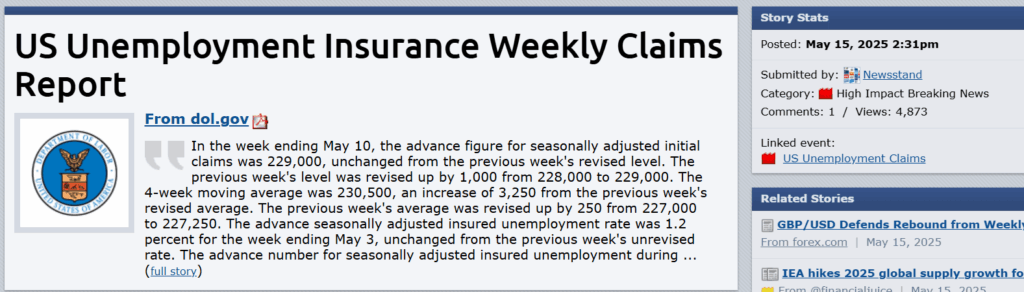
Ask yourself: Did high-speed traders manage to read, understand, and react to five of these reports within sixty seconds?
Plot twist: Notice the publication time—14:31, one minute late. The alleged “effect” on price had already occurred before the report was even published!
Key Takeaways
For the Skeptics:
- News events create volatility and reversal opportunities
- Content has minimal impact on actual price direction
- Cycle analysis provides predictive power that news analysis cannot
For the Traders:
- Focus on cycle timing rather than news content
- Use news events as volatility catalysts for cycle-based setups
- Targets and support/resistance levels can be identified in advance
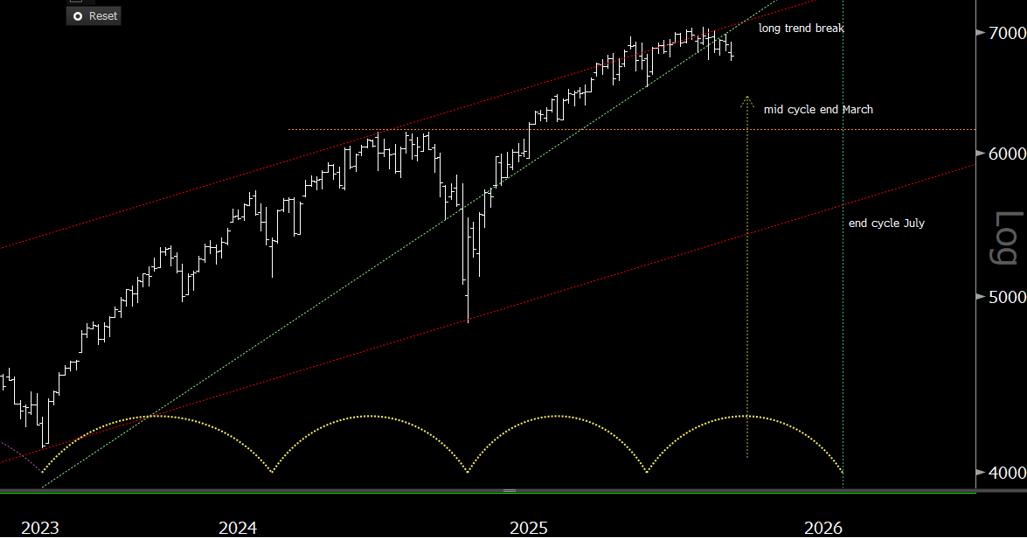
For the Bigger Picture:
- Other cycles (12-hour, 1-day) continue influencing price beyond the news event
- This was just one trade setup—the broader uptrend continues based on longer cycle influences
What’s Next?
If you’re thinking five-minute charts aren’t your style and you’re more interested in bigger impact events, we’ve got you covered!
Our next post examines a much greater impact news event with a time of return of one week: Trading the News II – Big Impact Events
Tools & Resources
The charts shown were captured from TradingView using the Sentient FLD indicator.
Access a free 14-day trial of the indicator here
This is Part 2 of our Sentient Approach to Trading the News series. Missed Part 1? Read: The Great Market Myth: Why News Doesn’t Drive Prices