Notes: we tend to focus on inflections on the weekly data level to strip out noise and, hopefully, call trades of more meaningful longevity. The basic system is a dynamic heatmap and colours: Up as Blue and Down as Red. Momentum is woven into the price series, such that paler colours represent lessening of power and stronger colours, increasing power. The sub-window shows the heatmap with momentum numbers at each timeframe from hourly to monthly.
Note: position changes Exiting Long JNJ US at market close 5 February. Position entered 13 January at 209.9 (see note of that date). Starting to get into overbought territory.
Bristol Myers Squibb Co (BMY) – break out to up continuation.
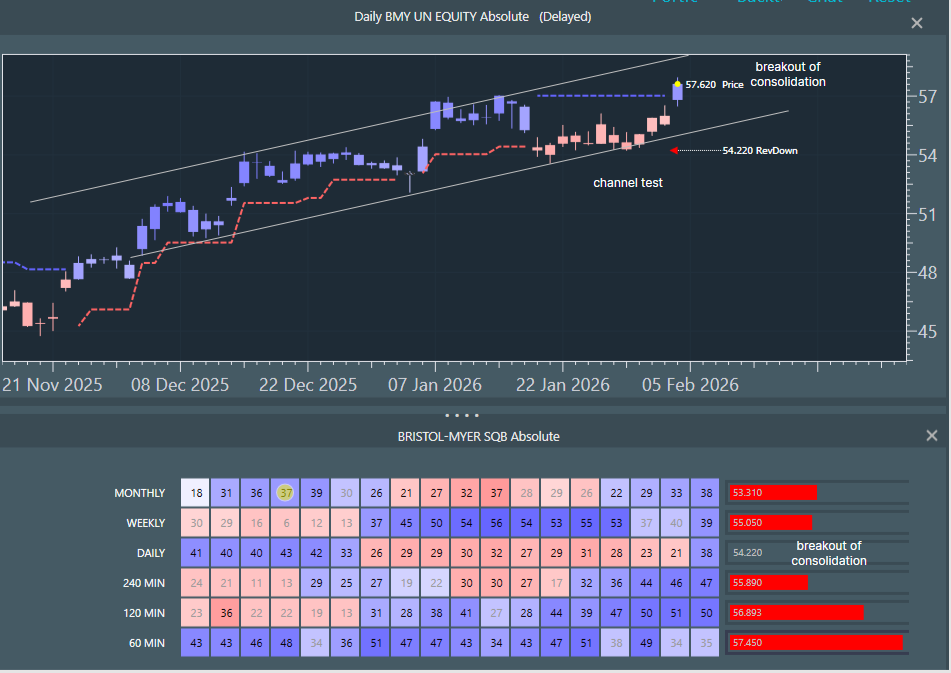
Daily chart consolidation breakout after channel test. Higher timeframes blue momentum increasing. Longer uptrend intact for a re-join.
Alphabet Inc. (GOOG) – trend breakdown threatened.
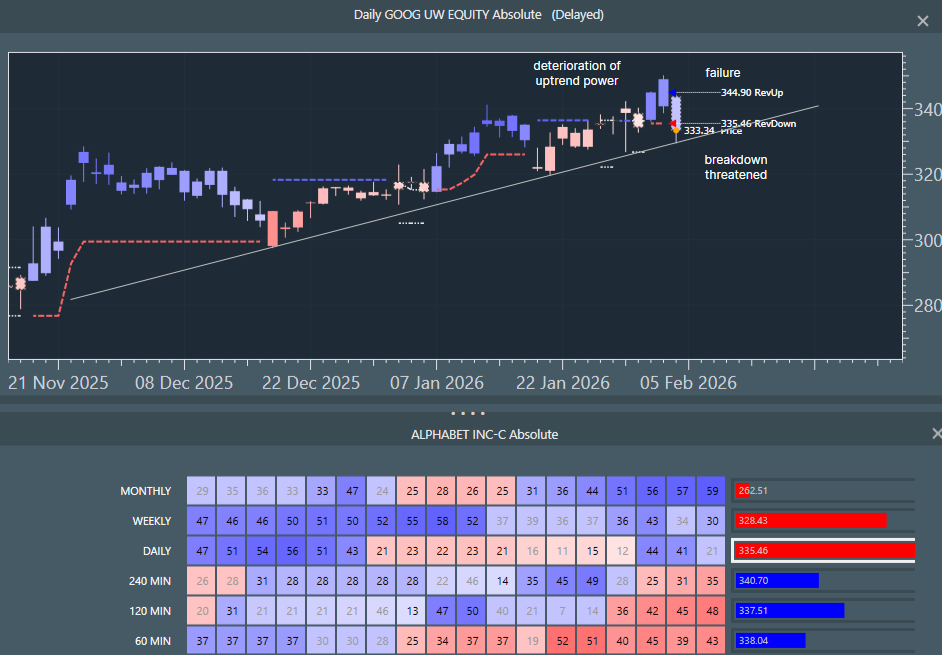
The daily chart has been rising in a shallow trajectory on weakening uptrend power. Blues deteriorating and too many rest phases to be healthy. Price jolted lower and is testing a breakdown on the uptrend support line. Intradays are red down. Weekly blue power has been bleeding out for eight weeks.
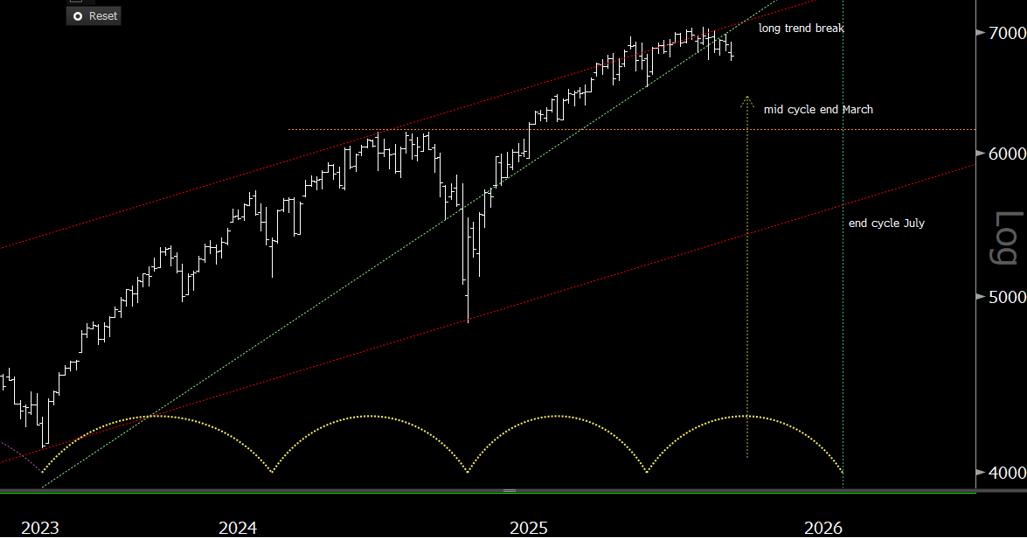
Tesla Inc (TSLA) – downtrend continuation
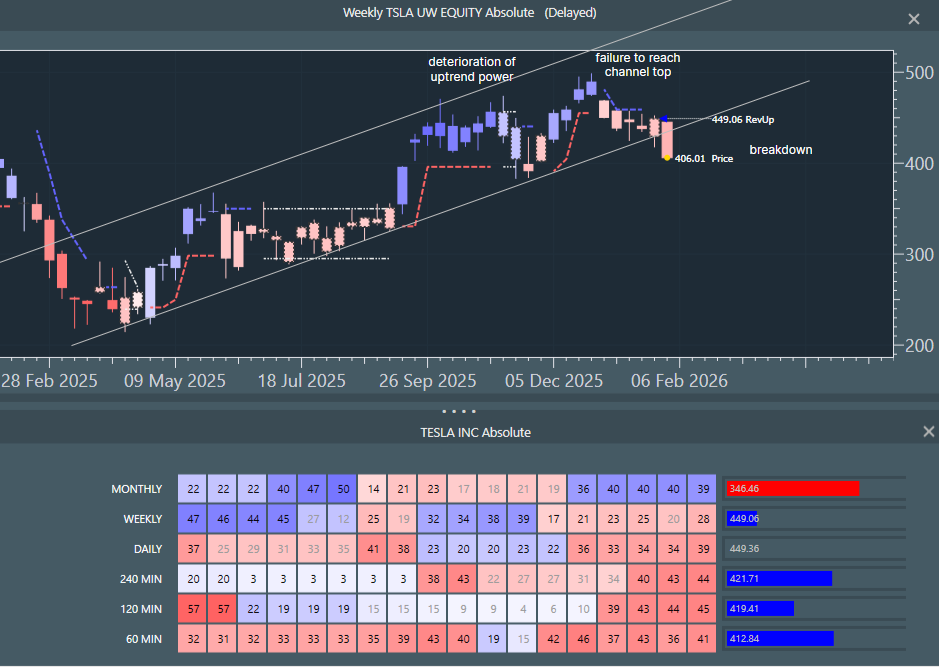
Weekly chart shows trend channel breakdown after significant uptrend deterioration. All timeframes from weekly lower are red down on increasing momentum numbers.
This post was first published on Hurst Cycles Notes.