The media is full of speculation about how long this bull market is going to last, and so I thought I’d throw in my two cents worth!
Of course the concept of “how long the bull is going to last” depends on your time-frame, but the bull market that everyone is discussing, and that I am writing about here is the move that started in March of 2009.
There is a wonderfully complex thought process that lies behind the Hurst Cycles logic that is used to answer this seemingly simple question. Complex but not difficult, it is bit like holding the many interlocking pieces of a jigsaw puzzle in your mind.
I describe the full process on the Hurst Cycles blog here, but if you’re short on time, here is a summary:
Because of the way in which cycle shapes in the markets follow a sequence, we can state that the current 9-year cycle peak will also be the peak of the current 54-month cycle, which will itself be the peak of the current 18-month cycle … and so:
The answer to our question: we expect the bull market to continue until about March 2015 (where the first peak of the 18-month cycle is likely to form). There will be another run up which will complete in about October 2015, but it is unlikely to exceed the earlier peak.
This logic is all based on the sequence of cycle shapes in the market. How reliable is that?
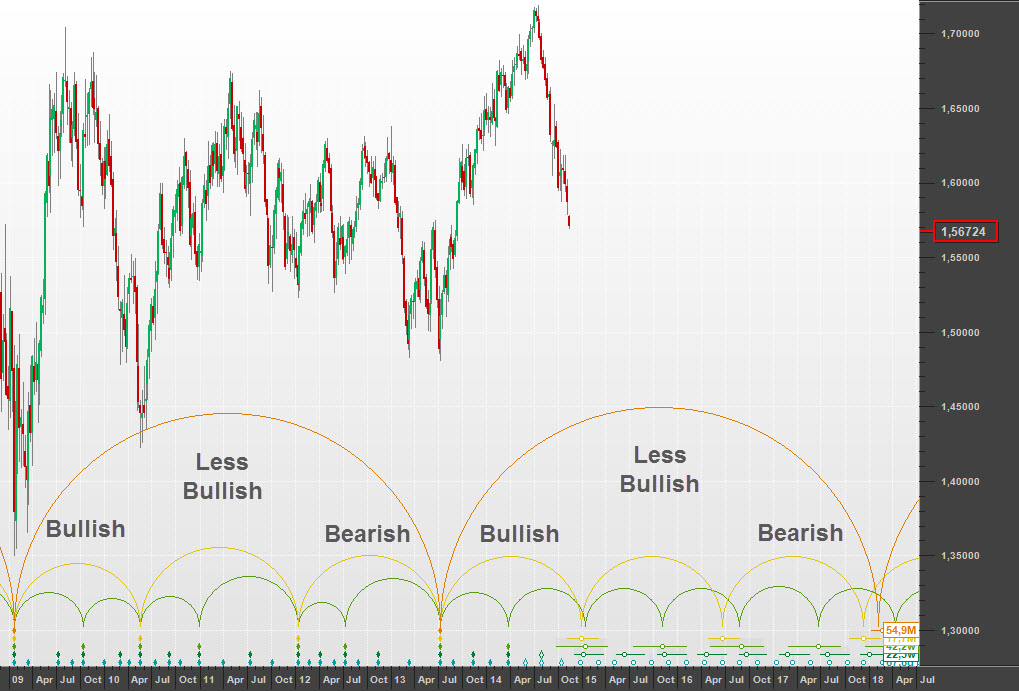
Here is an analysis of the GBPUSD (British Pound vs United States Dollar) showing how the sequence of 18-month cycle shapes has played out as expected in the current 9-year cycle:
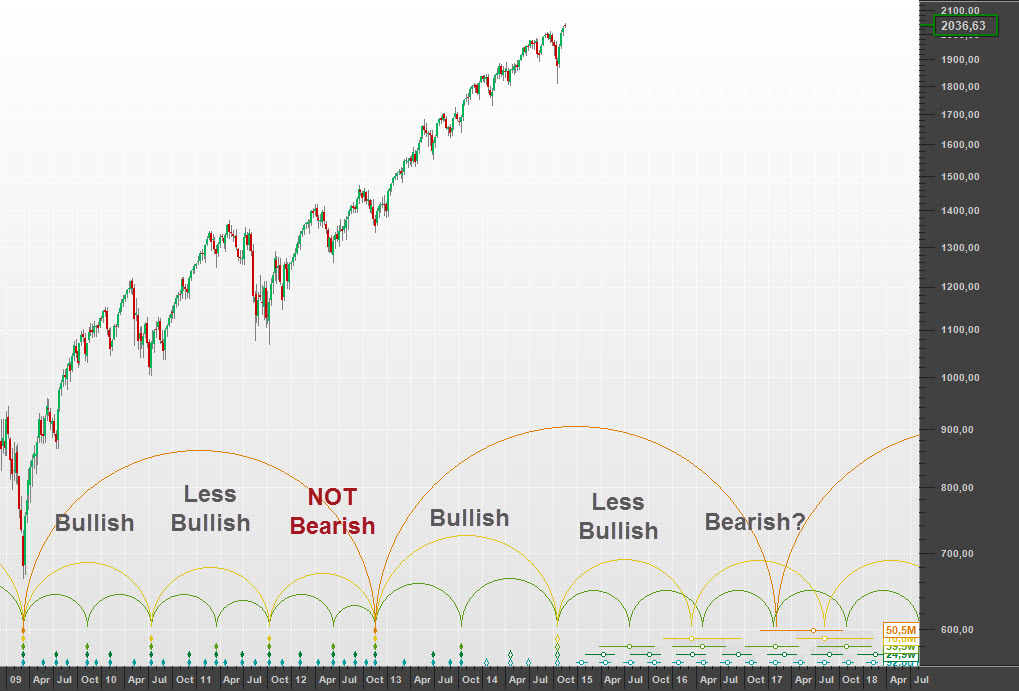
And here is that same period in the S&P 500:
Do you notice the anomaly? The 18-month cycle from October 2011 to November 2012 is not bearish. It is an inconsistency that has bothered me for almost three years.
It is either explained by accepting that the markets aren’t perfect, or by accepting that there is the harmonic echo of a six-year cycle at play (as discussed here), or perhaps this analysis is simply wrong.
I would love to hear what you think. Have a great week and profitable trading!


