Hurst defined two cyclic tools: the FLD (Future Line of Demarcation) and the VTL (Valid Trend Line). The FLD is in my opinion the more reliable of the two when it comes to trading (which is why we created the FLD Trading Strategy), but the VTL can often provide some insightful information.
The VTL is a trendline which joins two peaks or troughs, and which is “validated” by obeying a few rules that Hurst defined. When price crosses a VTL (drawn between troughs) from above it confirms that a peak of a cycle has formed in price, and when price crosses a VTL (drawn between peaks) from below it confirms that a trough of a cycle has formed. The cycle of the peak or trough which is confirmed is the cycle one degree longer in the cyclic model than the cycle whose peaks or troughs are joined by the VTL.
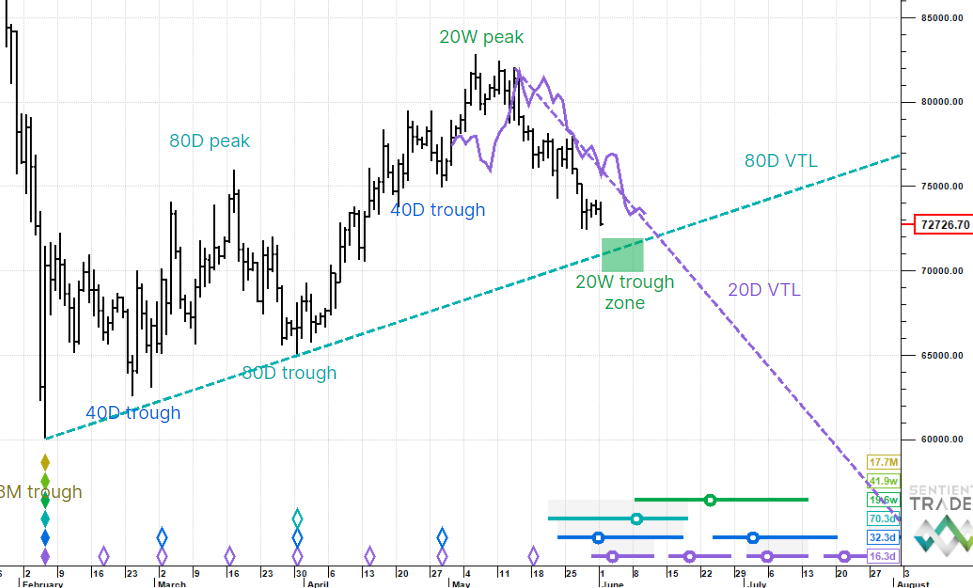
What usually happens after price crosses the VTL is that it returns to the VTL (as is often observed with any trend-line). In the case of a downward crossing by price, this return to the VTL creates a second peak, and gives rise to the typical M-shaped cycle.
I’m explaining all of this because it is exactly what has been playing out in the markets since price crossed decisively below the 40-week VTL on 7 November 2012. Since then price has been drawn up to touch that VTL no less than 5 times, as can be seen in this chart of the S&P 500 (ES futures contract):

(Note that the scaling is logarithmic – longer VTL’s work best on logarithmic charts) I have zoomed in on this chart to show the price reaching back up to the VTL, and so you cannot see the start of the VTL which is at the 18-month cycle trough on 4 October 2011.
What does this mean? The cross below the VTL indicates that the September 2012 peak was the peak of the 18-month cycle. The action of price rising back to the VTL is most often the final bull move of the cycle, sometimes referred to as the “final kiss goodbye” before price falls into the trough, and I continue to expect (as discussed last week) that the market will peak soon and slide strongly to the downside. There is still the possibility of the alternate analysis which I have been tracking in the Nasdaq, particularly as the S&P 500 reached new highs this week, exceeding the September 2012 peak, but this market does not feel to me like a fresh young bull, but more like a bull on its last legs about to turn bearish. An example of the weariness of the bull can be seen in the Nasdaq which has spent the last two weeks struggling to get much above the high level of the first day of trading this year.
The US markets are closed on Monday – always a dangerous time in my opinion. While we take a break the cycles keep moving!
S&P 500
The S&P 500 reached new highs this week, and closed at the high for the week. The new high either indicates that the November 2012 trough was an early 18-month cycle trough (the alternate analysis presented in the Nasdaq) or it contradicts the VTL information discussed above. At the moment the new high is so slight that I tend to favor the latter reasoning, but if price continues much further upwards we will have to accept the alternate analysis. The bar counts on this chart show that (according to this analysis) we still have two or three months to go before price is expected to form the 18-month cycle trough. Despite the new highs this week, I remain convinced that that we will see a strong fall into that trough.

Nasdaq
I have been presenting the alternate analysis in the Nasdaq because it might have formed an earlier 18-month cycle trough in August 2011 (as opposed to October 2011), although that is a moot point because in fact the lower price move took place within a single day. It is ironic that I am showing this analysis in the Nasdaq because the tech index has not been nearly as strong as the S&P 500 and has distinctly not reached new highs this week. As discussed last week if this analysis turns out to be the correct one I would expect a symmetrical price formation around the mid-November 2012 trough (because it is likely a straddled trough). There were 55 days between the peak in late September 2012 and the November trough, and 62 days have elapsed since that trough. Of course the symmetry is rarely perfect, but nonetheless I am standing by for the move downwards.

Euro/US Dollar
The Euro had a yo-yo week, most probably because it is forming the 20-day cycle trough following the 80-day cycle trough of 4 January 2013, as discussed last week. This trough is still presented as a nest-of-lows on this chart as Sentient Trader is struggling to accept the shortness of the cycle, but it seems the most likely analysis in my opinion.

Gold
Gold had a good week, rising to a new high which just might prove to be a better 80-day cycle peak than the 2 January 2013 peak we identified last week. If the 2 January 2013 peak was the 80-day cycle peak then we should see more bullish activity as it looks very much like a straddled 80-day peak, and we expect fairly symmetrical price action around a straddled peak.

30 Year US Bonds
Bonds formed a 20-day cycle peak this week, and dropped from that peak. They should reach up higher to form the 80-day cycle peak by the end of January.

Crude Oil
The 20-week cycle has been very dominant in Crude Oil recently, and so it is possible that the 80-day cycle trough we are expecting will be a subtle (perhaps even straddled) affair. But soon the second peak of the M-shaped 40-week cycle will form, and the price of Crude Oil will fall towards that large nest-of-lows seen at the right of the chart, in mid March.

US Dollar Index
The US Dollar bounced a little this week, possibly out of an early 40-day cycle trough formed on Monday. But the outlook for the next several weeks remains bearish as the Dollar forms the long 54-month cycle trough.

We are starting our next FLD Trading Strategy course at the end of this month, and so if you would like to learn how to make trading decisions on the basis of a Hurst Cyclic Analysis, make sure you enroll in the course.
Have a good week, and profitable trading!