You are probably aware of the fact that I find the FLD (Future Line of Demarcation) a very useful tool. My research (which is a kinder word than obsession) into why the FLD sometimes provides support or resistance instead of being crossed cleanly by price gave rise to the FLD Trading Strategy.
One of the finer details of the FLD Trading Strategy is to “beware the FLD spike” (see the “Final Briefing” video in Module Three). Because the FLD is not a smoothed line (it is based directly upon median price), it is a line which jumps around a good deal, and often we see “spikes”. Spikes are single bars where the FLD seems to deviate from its course, before returning to that course on the next bar.
The warning that spikes carry in the FLD Trading Strategy is that you should be careful of entering a trade near a spike because on the next bar the “crossing of the FLD” might disappear without price actually moving.
This week provided the perfect example. The trough that formed on 9 June in stock markets is a trough of either 80-day or 40-day magnitude (see the latest podcast for a discussion of these options). Either way it represents a potential buying opportunity in my opinion. But the markets never make it easy, do they? That possible long entry occurred right at the time of an FLD spike, which was a clear warning to wait until we could see what was actually happening with the price and FLD interaction. Here is a chart of the S&P 500 (ES futures) with the spike:

The spike occurs on Wednesday 10 June, and we end up with price crossed above the FLD without it exceeding the level of the spike high. Here is the other possible analysis, which has the spike in a slightly different position because of the different cycle wavelengths that result from the different analysis:

In this chart the danger of the spike can be seen clearly. Price “crossed” the FLD the bar before the spike, but only reached the level of the spike before falling down again.
A third view of the same spike, this time in the DJIA (YM futures) shows how price can rise to the level of the spike without actually crossing the FLD:
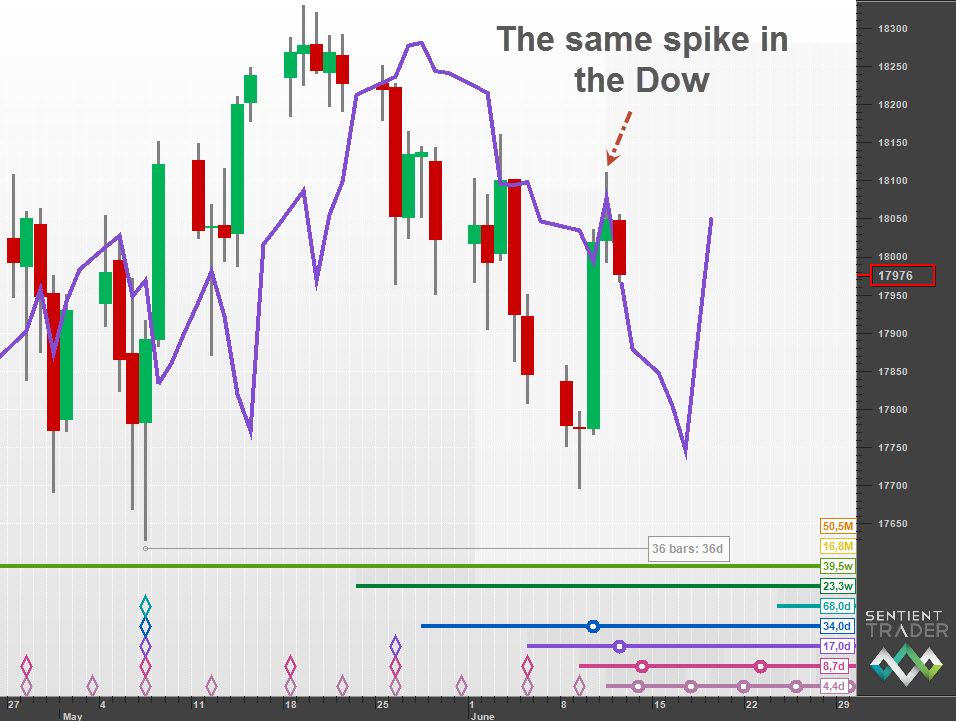
The FLD is a very useful tool, but it can be frustrating because of details like the FLD spike. The FLD does often provide perfect levels of support or resistance, but it also often provides a rather vague level such as we have seen this week.
This could be because the FLD is based upon Median price. Hurst recommended using an FLD based upon High or Low price for “action signals”, and this is probably why. In the full version of this post on Hurst Cycles you can see charts using the FLD based on High price.
Perhaps the FLD is better considered as a range instead of a line. The range from Low to High price. An FRD – Future Range of Demarcation, with the Median price FLD in the center. I sense a new feature coming soon to Sentient Trader.

