Cyclic analysts are familiar with the feeling of deja vu as the cycles repeat over and over again in the markets. Of course there is enough variation to keep us on our toes, and because of the multiple cycles which influence financial markets the situation is always a little different. History repeats itself … but not exactly.
Recently I have been tracking an interesting correlation with the market action three years ago. In October 2014 an 18-month cycle trough formed (in my opinion), with the next 80-day cycle trough in mid December 2014. And in October 2011 an 18-month cycle trough formed, with the next 80-day cycle trough in late November 2011. Three years ago we were witnessing the start of a three year bull run. Are we going to see the same again? I don’t think so. I have been expecting the 9-year cycle peak to form in markets as described in this post, and it is possible that peak formed in the last few days of 2014 in the S&P 500, and earlier in September 2014 in the FTSE (as discussed in this post).
And so, rather than looking forward to another three bullish years, I am expecting the markets to enter into a bearish mode. Are there any clues to be found in comparing the similar cyclic structure of today with three years ago? Let’s take a look.
Here is situation in the S&P 500 today:
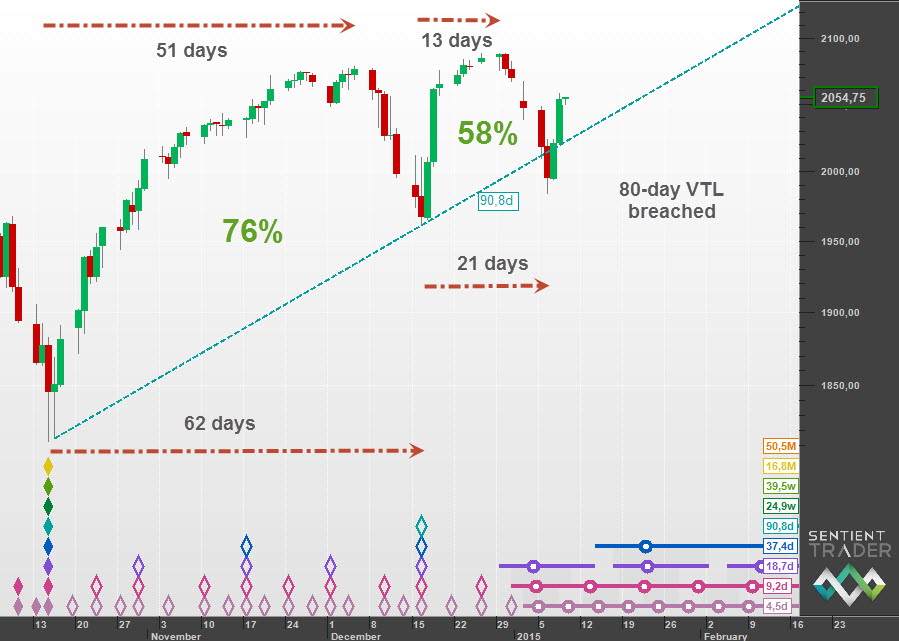
The bar counts at the top of the chart are the distance from troughs to peaks, of the 80-day cycle (from mid November 2014 to mid December 2014) and the 20-day cycle that completed earlier this week.
The green percentage figures are my way of measuring the “bullishness” of the market (as discussed previously). This shows that we had a good bullish 80-day cycle (at 76%), but the 20-day cycle that followed was distinctly less bullish at 58%. The next 20-day cycle (which is the current cycle of course) is expected to be less bullish – which implies a bearish cycle shape (less than 50% is a bearish cycle). A bearish cycle shape would result in the 40-day trough (expected towards the end of January) forming below Tuesday’s low of 1984.
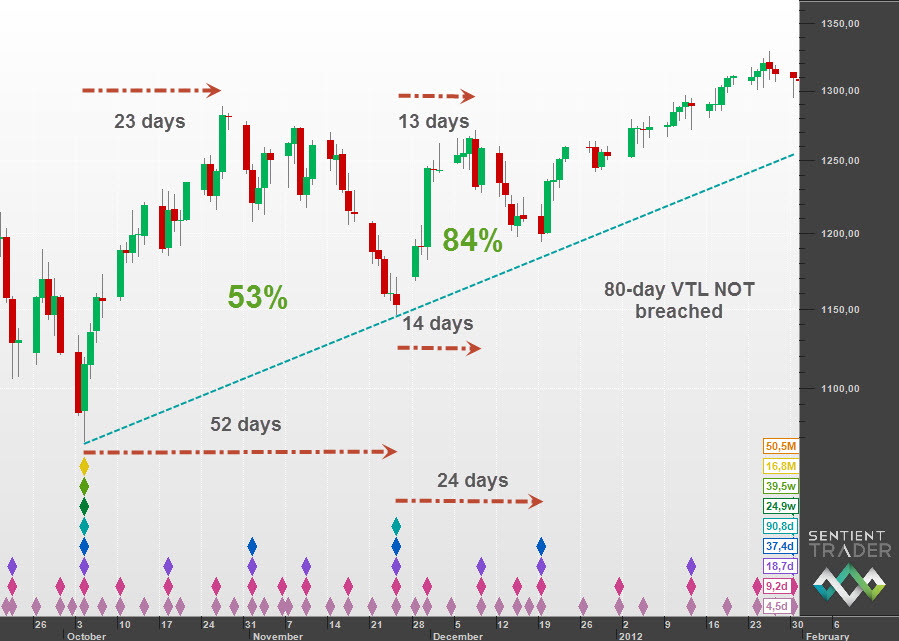
Now let’s compare this with the similar situation three years ago:
There are a few interesting comparisons to be made:
- First of all, the shorter 80-day cycle (52 days as opposed to 62 days). This could be simply the result of the Principle of Variation, but generally we expect earlier troughs when the underlying trend is more bullish, and so this is a first indication that we are in a less bullish state than we were three years ago.
- Secondly I find the progression of “bullishness” very interesting. I have often noted that at the beginning of a bullish run the bullishness can take a bit of time to build up – rather like a coiled spring. And so the absolute figures are not as important as the progression of the bullishness. Three years ago we had a slightly bullish 53% 80-day cycle followed by an 84% 20-day cycle. That’s what I mean by a progression of bullishness. On the other hand we see the opposite: a more bullish 76% 80-day cycle followed by a much less bullish 58% 20-day cycle. That is not a progression of bullishness, but a move towards “bearishness”.
- Thirdly note that the 80-day VTL three years ago was not breached (or touched) until much later. By comparison the situation today is distinctly less bullish.
- Finally note the compression of the cycles three years ago: a 52 day long 80-day cycle, followed by a 14 day 20-day cycle (and 24 day 40-day cycle). That sort of compression occurs at the beginning of a bull move. By comparison the cycles appear to be expanding at the moment, with a 62 day long 80-day cycle, and a 21 day long 20-day cycle.
In summary, it seems to me that this comparison warns us that the markets are turning bearish after years of bullishness.
If you would like to see a similar comparison in the FTSE please read the full post on Hurst Cycles: http://hurstcycles.com/deja-vu/
Potentially we are approaching a very bearish situation. I have been watching with some concern the endless stream of optimistic media reports about the continued bull market in 2015. I cannot say that I agree with them. I look forward to hearing what you think!

