Yes, that’s me, the last Euro Bull still standing! Actually that is a misleading title. I am not “still bullish”, but am about to become bullish. It might seem odd for me to be posting bullish thoughts about the Euro considering that yesterday the Euro dropped to its lowest level since July last year, but I think that we are about to witness a big event in the Euro, and that there are going to be some very good bullish profits to be made. Perhaps cyclic analysts are always contrarian!
Let me start with a long term picture, going back to 2005:
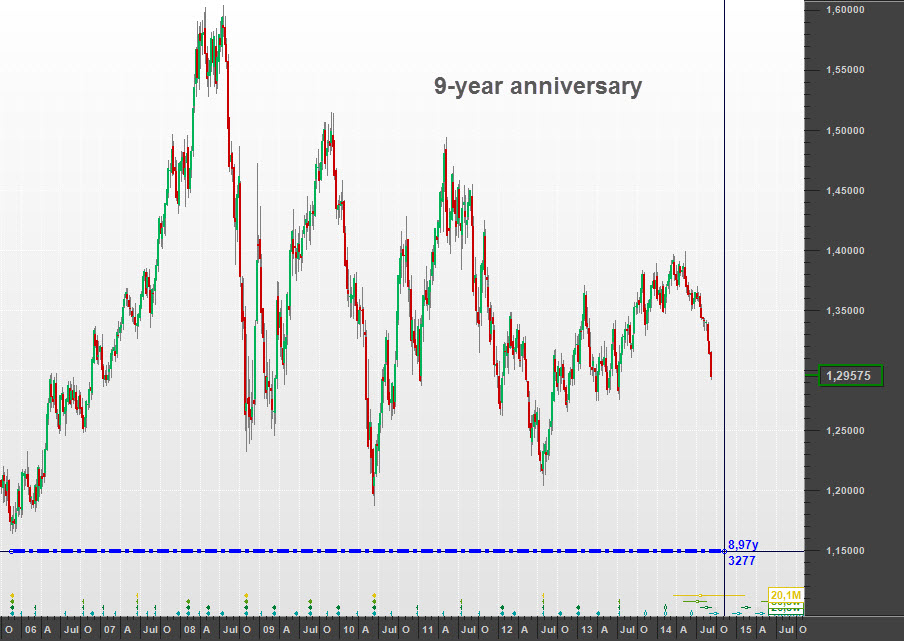
In November 2005 the Euro (data shown here is for the EURUSD forex pair) formed a trough of at least 18 month magnitude (far left of the chart). In the nine years since then the most prominent trough that formed was the low in early June 2010, which was 1667 days later. The average length of the 4 & 1/2 year, or 54-month cycle according the nominal model defined by JM Hurst in his Cycles Course is 1638 days. And so the relationship between those two troughs is almost certainly defined by the 54-month cycle. Now the Euro is heading down towards another trough, and it is interesting to note that we are only 60 days from an average 9-year cycle wavelength (which is 3276 days) from the 2005 trough. The chart above shows that an average 9-year cycle from the 2005 trough would cause a trough to form in early November this year.
According to Hurst’s nominal model there are three 18-month cycles within each 54-month cycle (it is the only pair of cycles in the nominal model that exhibit a 3:1 harmonic ratio with each other instead of a 2:1 harmonic ratio).
However since the June 2010 trough something interesting has happened: the 18-month cycle has stretched, and in the past four-and-a-bit years the Euro has described not three 18-month cycles, but two “18-month” cycles of roughly 25 months each (so far).
You are probably beginning to realize that I am about to suggest a “breaking of the rules”. I would like to suggest that instead of sub-dividing into three 18-month cycles, the current 54-month cycle has sub-divided into only two cycles.

I have shown on this chart where the average wavelength of the 54-month cycle would cause us to expect a prominent trough to form: early December this year, a mere 27 days later than the projection of the 9-year cycle shown above. But there have not been three 18-month cycles, there have been only two. Is that possible?
If it is the case that the 54-month cycle is sub-dividing into two instead of three (despite the fact that it breaks the rules), then here is the reason that I am about to become bullish: the Euro is heading down into a trough of 9-year magnitude, which is expected to form any time now, or within the next two to three months.
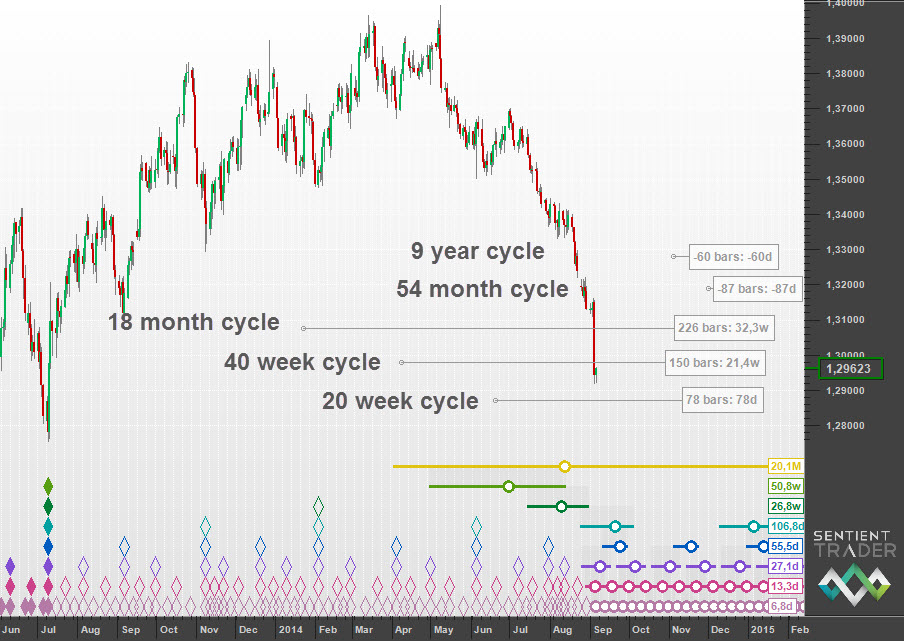
In this chart I have used Sentient Trader’s bar-counting feature to create an approximation of the 9-year nest-of-lows. It is a staggered nest-of-lows because of the fact that the shorter cycles are all so overdue (as can be seen in Sentient Trader’s 18-month nest-of-lows at the foot of the chart). But I think it shows a very viable analysis, assuming that it is possible that the 54-month cycle can sub-divide into two instead of three.
This is an abridged version of the full post on the Hurst Cycles website ( http://hurstcycles.com/the-last-euro-bull/). The Hurst Cyles website is a collection of Hurst analysis from many different analysts around the world.
Have a great week and profitable trading!

