One of the issues that newcomers to Hurst’s Cyclic Principles struggle with the most is that at times markets seem to be showing very little cyclic influence, and they move in a straight line, up, down or flat. Other cyclic theories suggest that cycles come and go, that a cycle will move the market for some time and then simply disappear. Not so with Hurst cycles. Periods of straight-line movement are explained by the way in which multiple cycles combine, and by the fact that the amplitude of cycles varies greatly.
It is all very well to understand why things happen, but the true value of this understanding lies in being able to forecast turning points in the market and trade accordingly. For the past 7 weeks the US markets have been “flat-lining” in an upwards direction and providing us with a challenge: when is the peak going to form? The answer is provided by identifying the subtle clues that the market gives us when the cycles all but disappear from view.
I have been developing this theme for three weeks, and so if you haven’t been reading regularly, make sure that you catch up with past issues. The process begins with identifying the dominant cycle, then finding the subtle troughs of the shorter cycles, and finally one needs to distinguish these subtle troughs as either hidden troughs (that is my term for them, you won’t find it in your Hurst glossary!) or straddled troughs (that is a Hurst term).
This is how I differentiate between the various types of subtle troughs:
Subtle troughs are low points in the price movement which are the troughs of a cycle, but price does not fall into or bounce out of the trough to an extent (or duration) commensurate with the magnitude of cycle that is forming the trough.
Hidden troughs are subtle troughs which occur during an extended bull or bear move, and form little more than a blip in the general move (which is the dominant cycle’s move). The implication of a hidden trough is that price will rise or fall further, depending upon whether it occurs on the way up or the way down. Often a hidden trough on the way up is followed by a straddled trough in the cycle one degree shorter. For example a hidden 80-day cycle trough is often followed by a straddled 40-day cycle trough.
Straddled troughs are a specific form of a subtle trough usually more prominent than a hidden trough. The distinguishing characteristic of straddled troughs is that price action is fairly (rarely perfectly) symmetrical around the straddled trough. The implication of a straddled trough is clear: price will form a second peak (symmetrical with the peak that precedes the straddled trough) and that will be the final peak of the move.
I should make it clear that straddled troughs were defined and discussed by Hurst. The concept of hidden troughs is my own, and so it is not pure Hurst theory, but an extension of Hurst theory based upon my observations.
Here is an infamous example of a straddled trough:

The green ellipse highlights the symmetrical price move surrounding the straddled 18-month (at least) trough of August 2007.
Here is an example which brings all of these elements together:

The dominant cycle is the 40-week cycle. Note the hidden trough of the 20-week cycle marked with a green arrow, and the straddled trough of the 80-day cycle with the fairly symmetrical price action surrounding the trough highlighted with a green ellipse.
What is happening in the markets now? Two weeks ago I identified various dominant cycles. In stock markets around the world we are expecting a subtle trough of the 80-day cycle to form. Some of those troughs will probably turn out to be hidden troughs, and some will be straddled troughs. Last week I showed some markets from Europe because they provide interesting variations on the theme. Here is the FTSE:

Note how the 80-day cycle trough is looking very much like a developing straddled trough. Here is the DAX:

Here the 80-day cycle trough is looking more like a hidden trough on the downside, indicating that the bearish move has only just started.
S&P 500
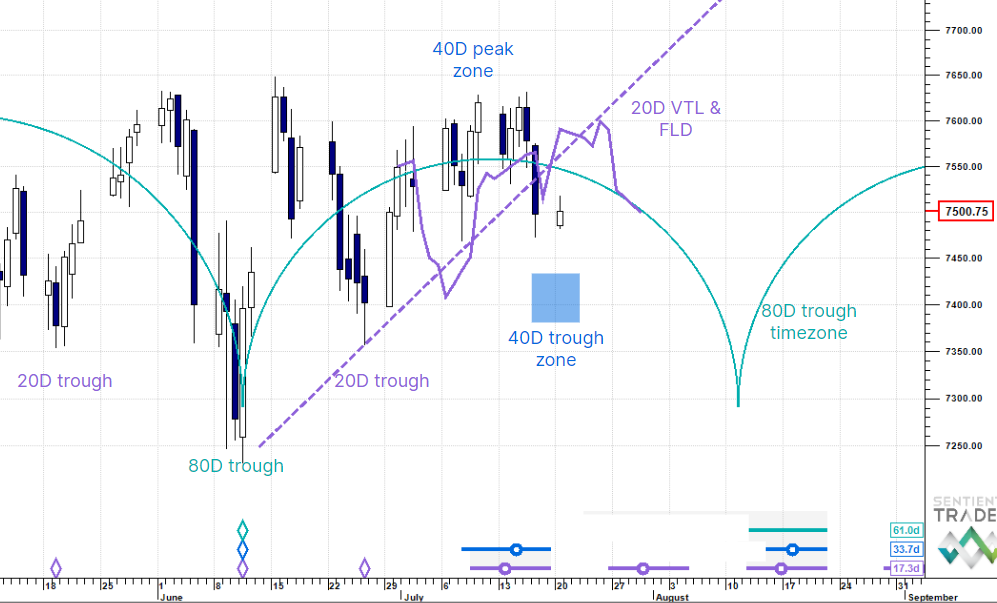
Last week I suggested that the S&P 500 formed its subtle 80-day cycle trough on 4 February. That trough is a good example of a hidden trough, implying that price will extend upwards (as it has done), and we should look to a possible straddled 40-day cycle trough in the middle of March. The peak is imminent, and in the next few weeks we should see the strongest move down since the end of last December as price heads down into that trough.

Nasdaq
I am tracking the alternate analysis in the Nasdaq which positions the 18-month cycle trough in November of last year. The recent subtle trough on 4 February is a trough of the 40-day cycle, and looks as if it will be a straddled trough, although the recent dominance of the 10-day cycle is causing a good deal of short term volatility while the market effectively moves sideways, making the identification of the longer cycle troughs particularly tricky.

Euro/US Dollar
The Euro is forming good clear cycles and so the only subtle troughs here are at the 20-day and shorter level. The 40-day cycle trough is expected to form now.

Gold
Gold is analyzed “inverted”, with synchronized peaks, and so here it is the peaks that might be subtle (depending upon cycle dominance and the amplitudes of the various cycles). The 80-day cycle peak which formed in mid January was not very subtle, but it does qualify, and looks as if it is proving to be a (not very) hidden peak. That implies a further downwards move and the possible formation of a straddled 40-day cycle peak in the next few weeks.

30 Year US Bonds
The 80-day cycle peak in Bonds is looking like a subtle affair on 7 February, and thus far the price action has been very symmetrical which indicates that the peak could well be a straddled one.

Crude Oil
Crude Oil was expected to form a subtle 80-day cycle trough, and the exact placement of that trough is difficult to determine (as is usually the case with subtle troughs). The most likely scenario is that the 80-day cycle trough was a hidden trough in early January and that the trough which formed this Monday, 11 February was a straddled 40-day cycle trough. That would indicate that Crude Oil has formed its peak and is now headed down to the 18-month (perhaps 54-month) cycle trough expected in March. Compare this chart to the second chart in today’s post. Here too we see all the elements coming together: a dominant cycle, a hidden trough and a straddled trough.

US Dollar Index
As discussed last week the 18-month (and possible 54-month) cycle trough might well have formed at the beginning of February. There have been no subtle troughs here recently, and as mentioned last week we must watch this bounce for evidence of the recent trough magnitude. Here is the less bullish possibility, that we have another downward leg to go before the formation of the 18-month cycle trough:

Analyzing financial markets according to Hurst’s Cyclic Principles is a constantly fascinating process. The greatest challenge is getting the analysis right when the markets are not exhibiting the clear and obvious cycles that newcomers to the “art of analysis” expect.
The US markets are closed on Monday, and with peaks imminent in those markets caution is definitely in order.
Have a great week, and profitable trading!
P.S. If you are just getting started with Hurst analysis and trading, we have a “getting started” special running for the month of February.