Before we look at the markets, have you joined us in the Hurst Trading Room live webinars? They are a lot of fun, and the feedback has been that they are proving very useful, so please join us this Monday: register here.
In my last post I discussed some possibilities for the August 2015 trough, including one particularly bearish possibility: that the 40-week cycle trough actually occurred in early July 2015, and the big drop in late August was a fall into a smaller cycle trough.
To receive these blogs as soon as they are posted Join/Like/Follow Us. If you don’t do social media – click to Join Feedburner to receive these blogs by email.
Here is the most “obvious” analysis:
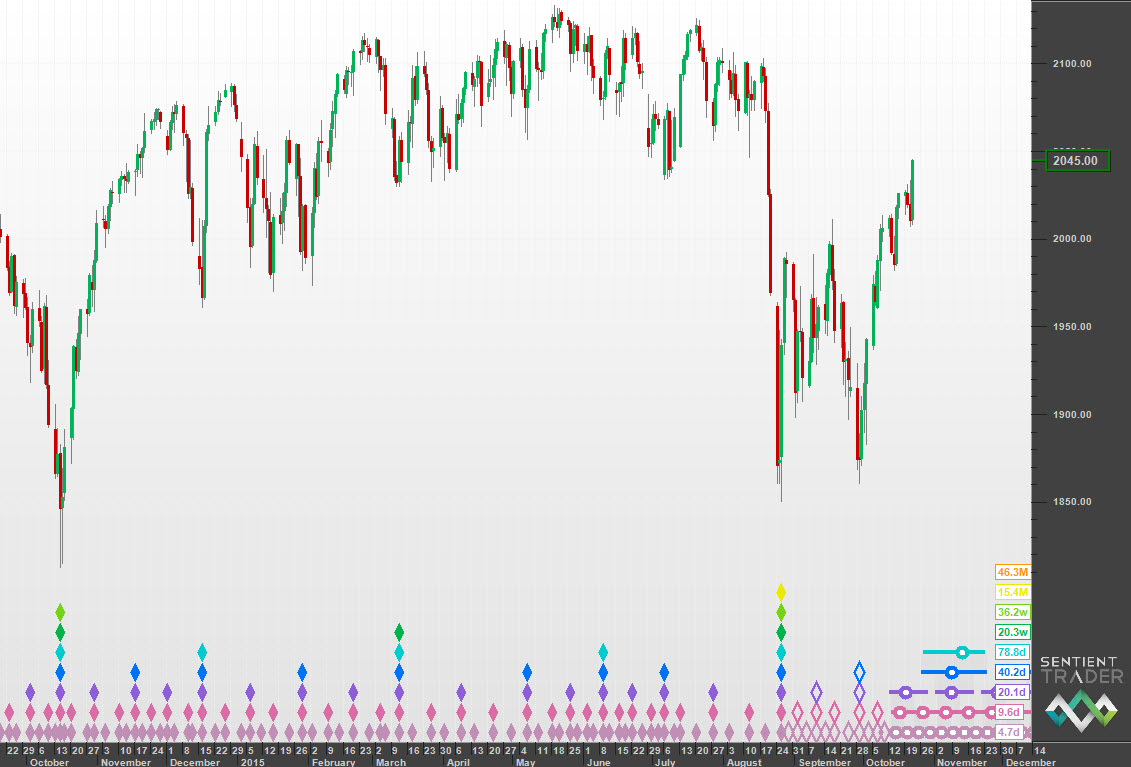
I say it is obvious because that big drop in August was a move befitting an 18-month cycle plunge. Since then the market has produced a very neutral-shaped 40-day cycle, before springing up with enthusiasm into October. I have written before about the fact that we sometimes see a neutral-shaped short cycle preceding a strong move (see this post about the Euro in which I demonstrate an example in the Nasdaq 100).
Here is a detailed view:
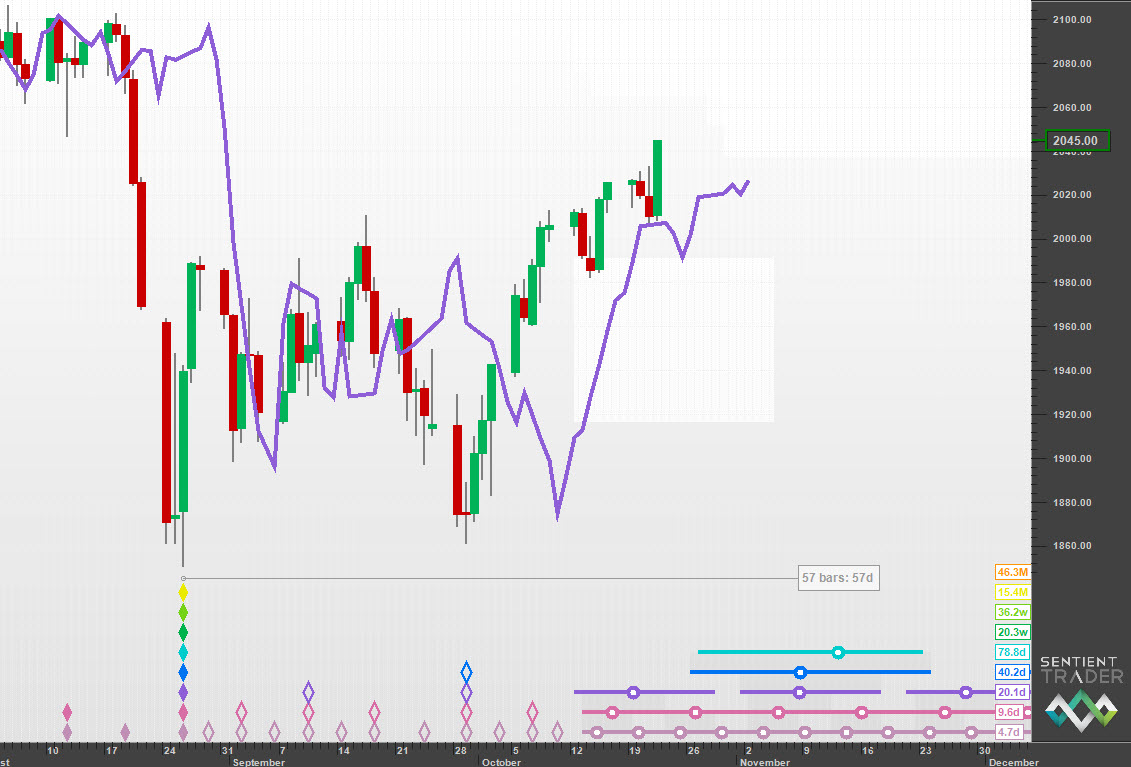
That purple line is the 20-day FLD, and we would expect price to drop down through that FLD on its way to the 80-day cycle trough, which is expected in about 11 days. But surprisingly price has found resistance at the FLD line. There is no difference if we consider the alternate option that the August trough was of 40-week magnitude:
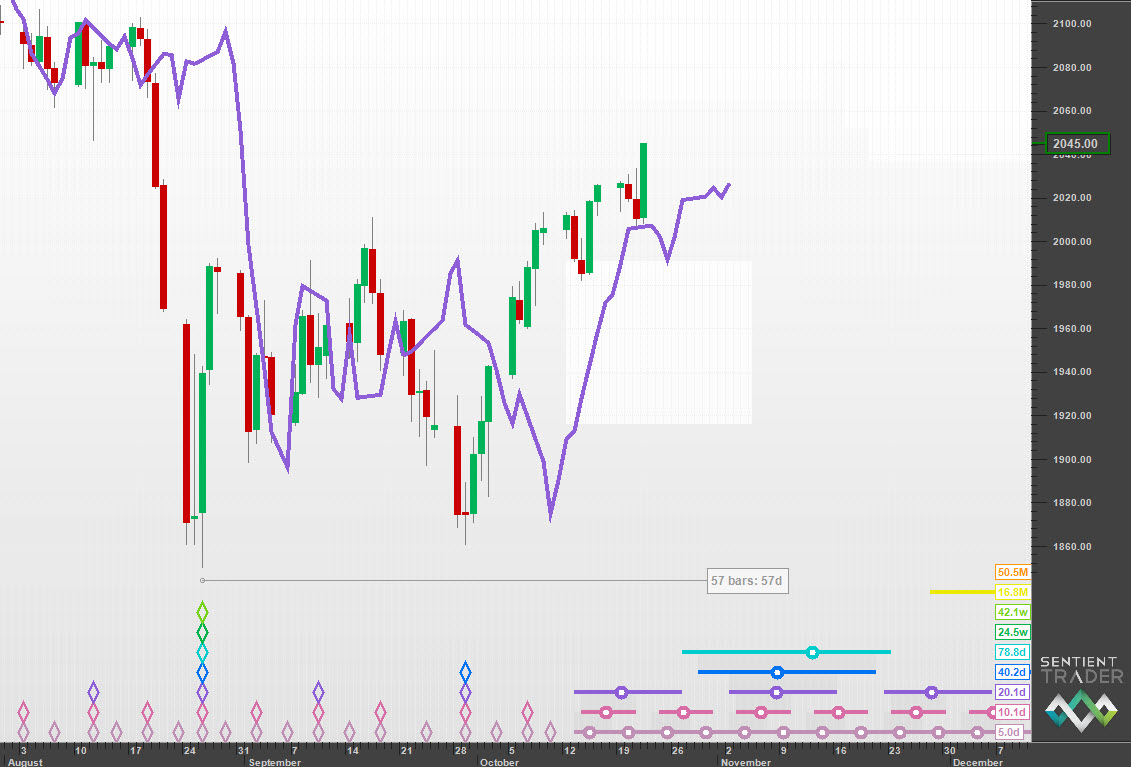
Of course an inappropriate interaction with an FLD does not disqualify an analysis, but the alternate placing of the 40-week cycle trough in July provides us with an option that would have us expect this FLD interaction:
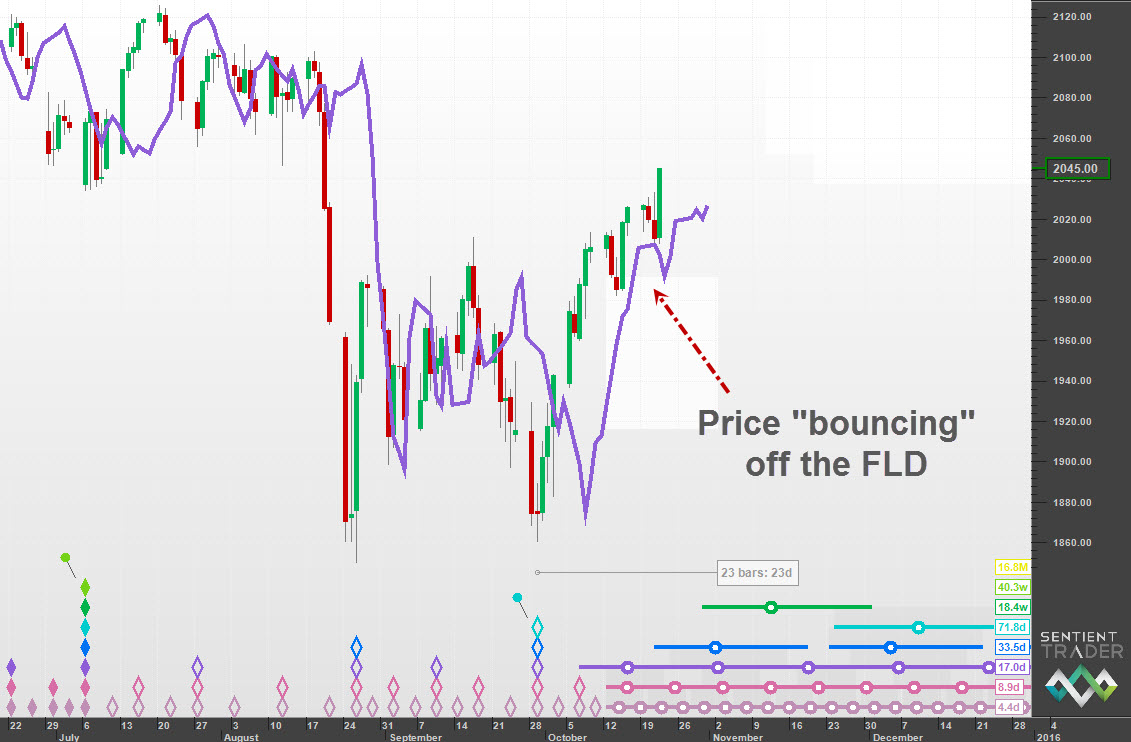
In this analysis price is bouncing out of the 20-day cycle trough after an 80-day cycle trough at the end of September. And at that point we expect price to find support at the level of the 20-day FLD.
This interesting solution to the FLD problem does not guarantee that the above analysis is the correct one, but it definitely needs to be an option that we keep our eyes on. Because if it is correct this “big bounce” is only going to carry us to the peak of the 80-day cycle before we head down again, and probably head down with some speed.
How possible is it that this is the correct analysis? The only big problem with the analysis is that the 40-day August trough is dropped below both of the 80-day troughs to each side of it (the early July and late September troughs). But in fact it was only slightly lower than the trough at the end of September, and that was for brief periods of time on the three days 24-26 August. After the very strong drop into 24 August there was a good deal of emotion and panic going around, and so I think we could give the markets a little leeway. What do you think?

