Last week I discussed the implication of the 20-week VTL breach in the S&P 500: That we have seen the peak of the current 40-week cycle in the markets. VTL’s are not as reliable as FLD’s in my experience, but it has been interesting to watch the S&P 500 reach up towards a new peak this week, but fail to reach new levels. At least so far, at the time I am writing this.
Could it be that the time has arrived for the turn down? In this analysis we can see a distinct fading of bullish impetus on each bounce out of a cycle trough:
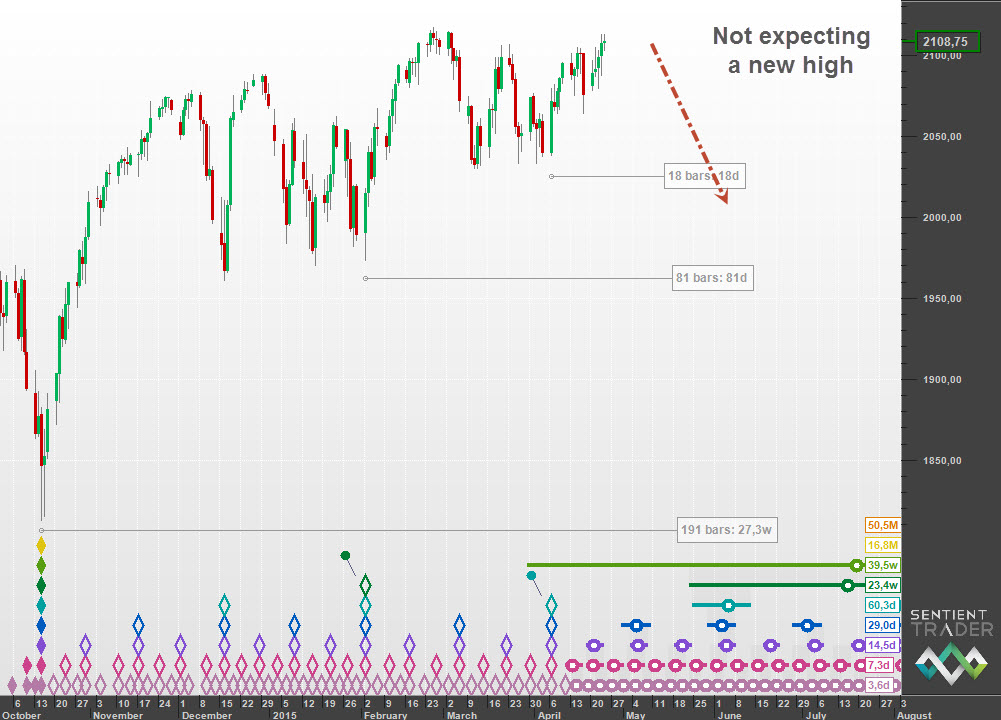
This analysis assumes that the 80-day cycle trough formed over the Easter weekend (as discussed last week). I particularly like the neat vertical nest-of-lows that result from the analysis, but that could just be my inclination to look for symmetry in everything.
The interaction between price and the FLD this week supports the analysis, as shown here:
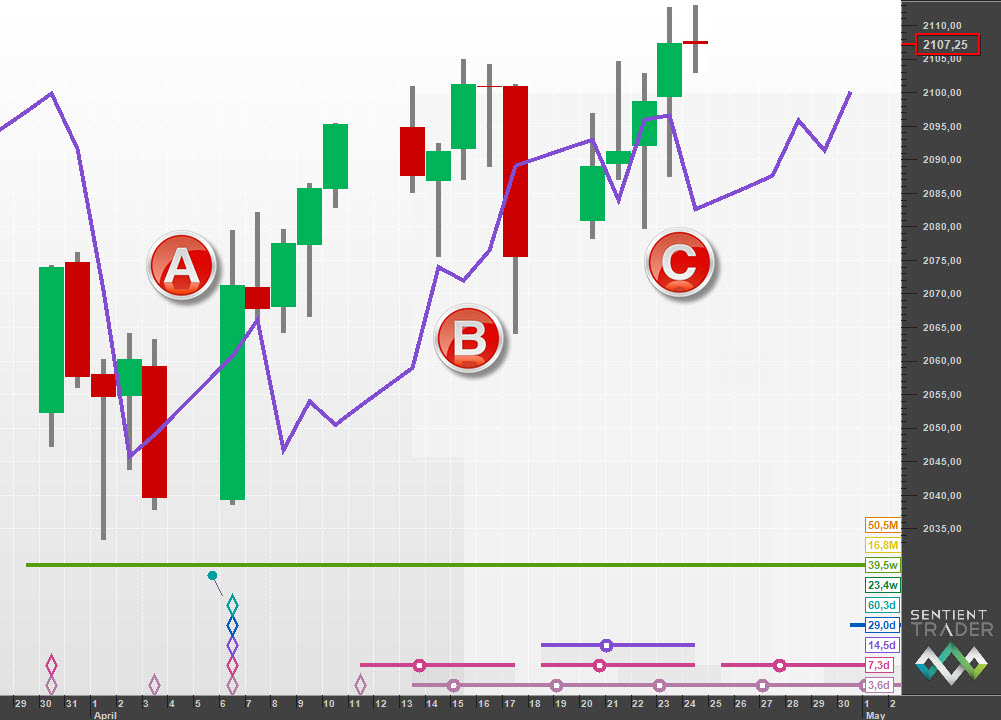
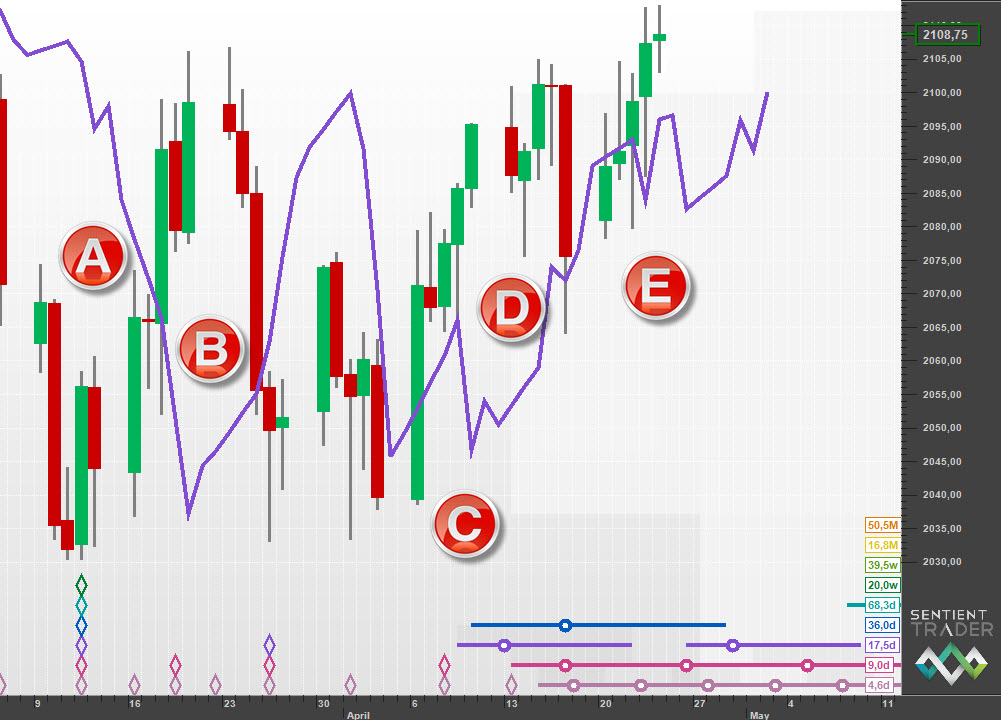
It supports the analysis because we expect price to track along the 20-day FLD between interactions B & C, which is exactly what it did. The alternate analysis which expected the 40-day cycle trough at the end of last week, has price tracking along the 20-day FLD between interactions D & E, which is less common in my experience. Here is that analysis:
As is often the case with Hurst analysis, it doesn’t really matter which analysis is correct. At least in terms of expecting a turn down to occur soon. An important level to watch is the level of the 80-day VTL, shown here:
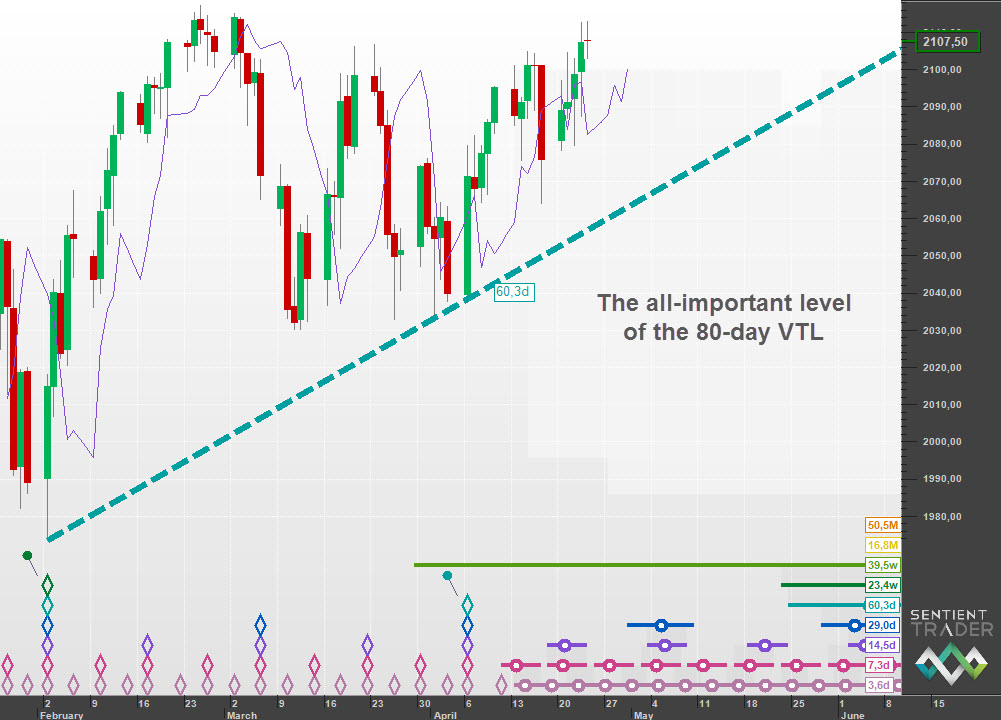
I would not be surprised to see the market drop down to a 40-day cycle trough in early May, then bounce up again before finally breaching that 80-day VTL, after which it will be a slippery slope down the 40-week cycle trough which is expected in June 2015.
Have a great week and profitable trading!

