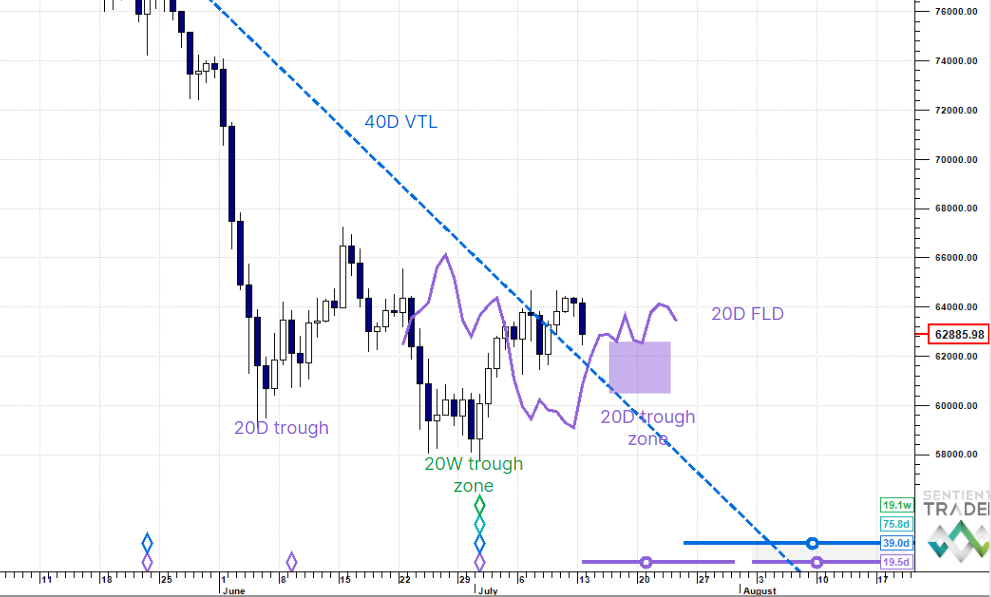
This quick post was inspired by tweets made by Oren @ChartingCycles. We thought they provided an excellent example of the way in which a Hurst Cycles analysis can allow us to anticipate turns in the market.
The analysis is provided for your consideration and is not to be construed as financial advice. Please bear in mind our disclaimers which apply to all posts on this site.
@ChartingCycles has been posting excellent Hurst Cycles analyses done on Sentient Trader to his twitter page, which we recommend checking out. He has also been doing an amazing job of keeping track of the analyses and seeing how they turned out.
In this post we are sharing a recent pair of tweets showing his analysis of $ZM, which provide a demonstration of the predictive power of Sentient Trader.
The first tweet was posted on 1 September 2021:
$ZM – Likely has a month more of downward pressure before starting its rise into the 18m peak. pic.twitter.com/bJTIyYBSKB
— ChartingCycles (@ChartingCycles) September 1, 2021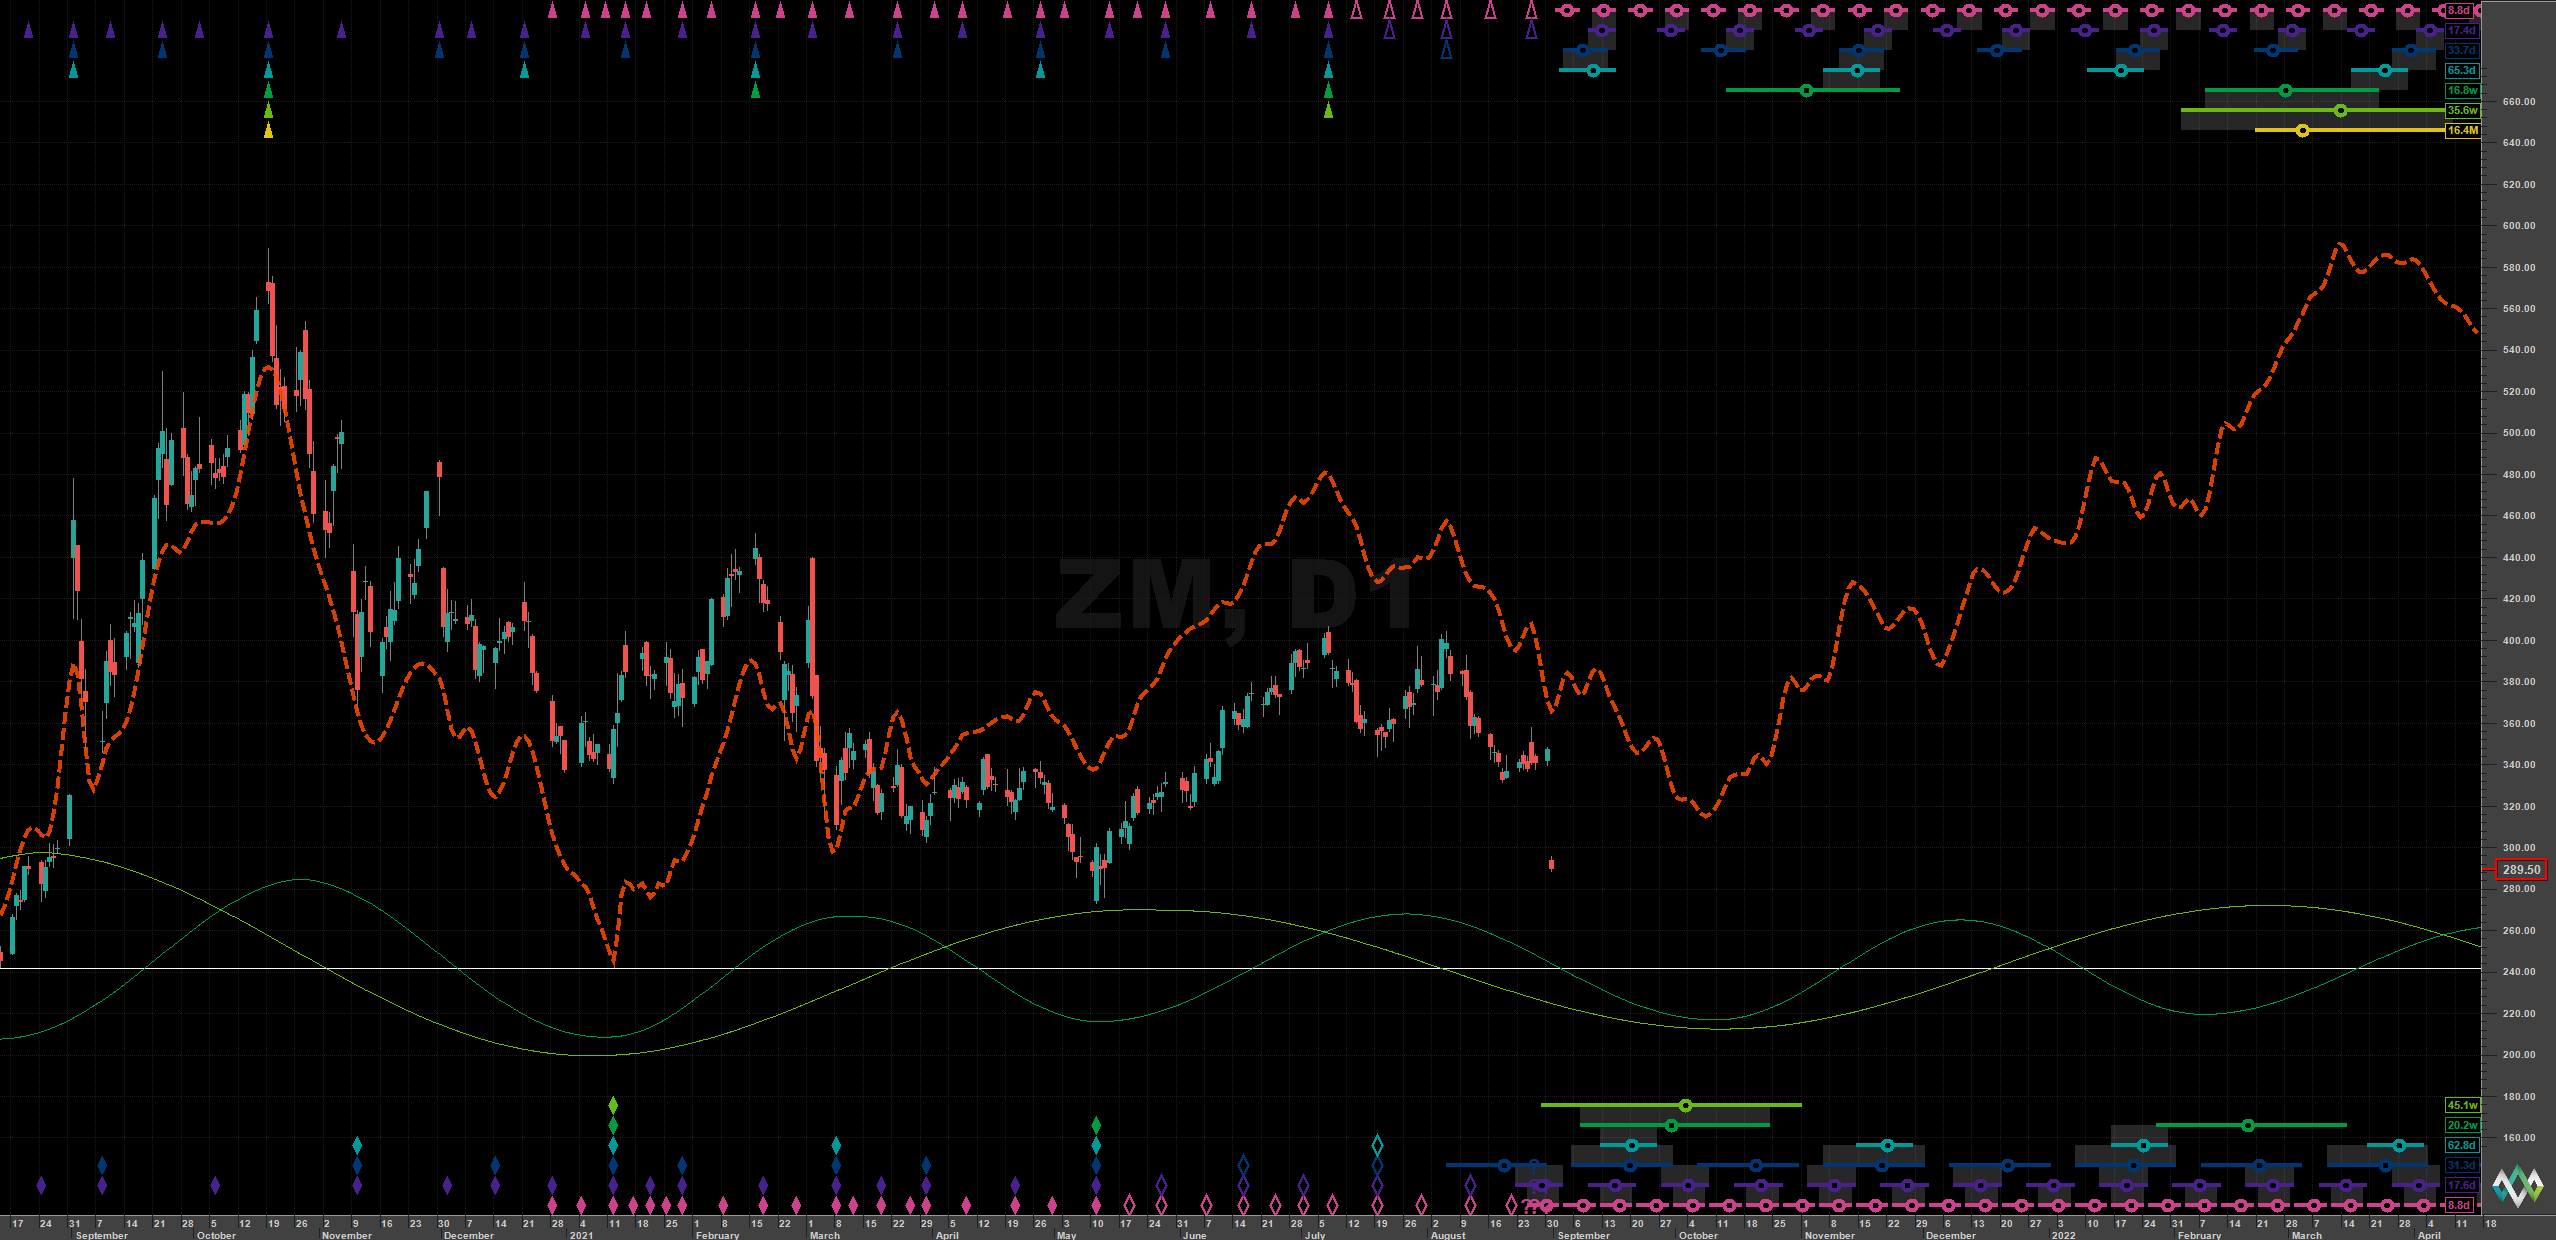
And then there was a follow-up tweet on 23 October 2021:
$ZM – The model perfectly timed the October 6th trough. Note that the cycles have shifted a bit in the latest analysis. pic.twitter.com/ptnZNaLrIY
— ChartingCycles (@ChartingCycles) October 23, 2021
If you would like to see the original tweets, here they are:
$ZM – Likely has a month more of downward pressure before starting its rise into the 18m peak. pic.twitter.com/bJTIyYBSKB
— ChartingCycles (@ChartingCycles) September 1, 2021
And the follow-up:
@SentientTrader not too shabby ????
— ChartingCycles (@ChartingCycles) October 23, 2021
If you are on Twitter we would encourage you to tune in to the conversation about Hurst Cycles. There is some expert analysis being posted there.