You will come across specific terms in these notes (FLD, VTL, and so on). Rather than explain them each time, you will find definitions here: guidance notes for Hurst cycles terminology
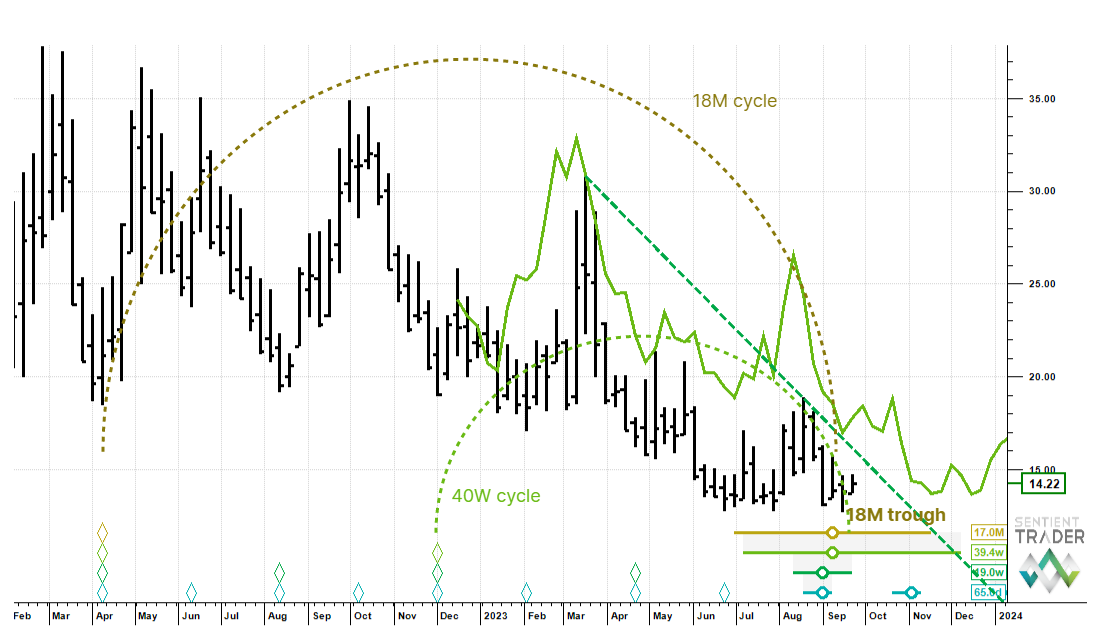
VIX – testing an 18 month cycle trough? Readying for an upside explosion in vol?
Can one actually perform trough-synchronized cycles analysis on such a jagged series as VIX (which is usually considered as peak-synchronized)? We were not sure, so we tried, and the results are intriguing.
We used the spectral analysis tool to work the analysis up here and on this weekly chart it looks like the long cycles are surprisingly regular and coherent. Not what would be expected from a peak-synchronized instrument. It also looks like volatility is in an 18 month cycle trough zone! Which implies meaningful upside if it is confirmed. We must factor in that large degree troughs in a peak-synchronized instrument can take their own sweet time finding their eventual footing (here the ochre 18 month cycle trough circle and whiskers extends out to mid November). But with that said, volatility downside here looks to be the lower risk than a sharp upside break, with all that implies for global markets.
The green dashed downtrend line is the 20 week VTL and if this is crossed up (circa 15) then we know that the 40 week cycle trough is in place and by extension likely the 18 month cycle trough too. We would need to get to around 17 to cross the 40 week FLD but if this does happen then the upside projection is at least 21. Stay alert, that’s as far as we are going to take the analysis.
This post was first published on Hurst Cycles Notes.