This Cycle Outlook has been kindly provided by David Walling.
The analysis is provided for your consideration and is not to be construed as financial advice. Please bear in mind our disclaimers which apply to all posts on this site.
Please note: Any questions about the post will be answered by our team, not by the contributor.
Today, I did another update of the analysis’ that I’ve been tracking for IWM, QQQ and SPY and I believe I finally have some degree of clarity again. I hope so anyway.
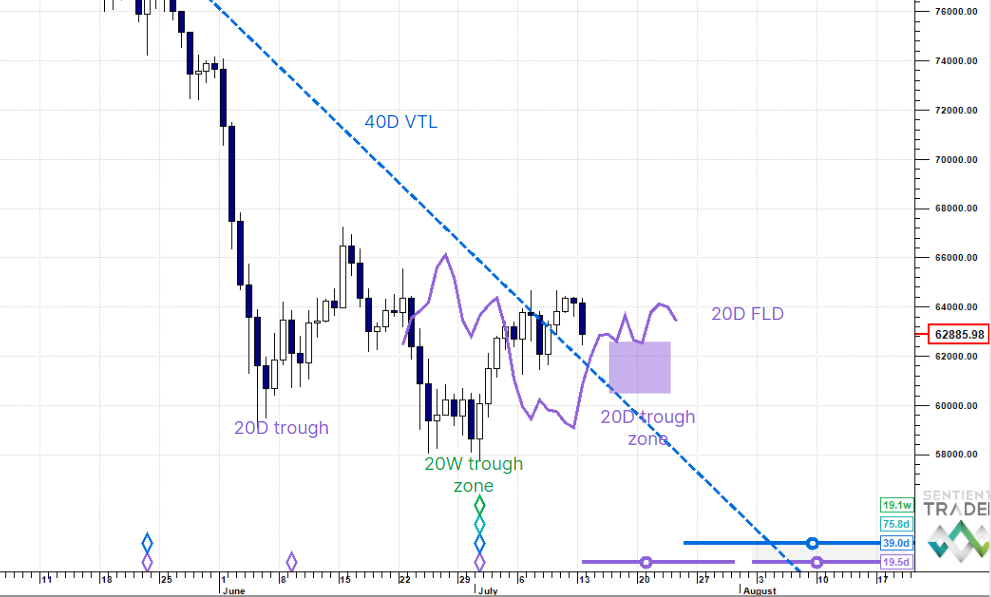
 IWM – it appears that the 20d trough formed over the Labor Day weekend as I had expected it might per my September 3rd writeup. Price probably formed a 10d trough today, September 14th—where the 20d cycle peaks, the 10d cycle forms a trough. Just visually looking at the chart, it is apparent that the downside target generated by price crossing through the 20d FLD exceeded the projected price target to the downside. When this occurs, cycle analysts consider to be a sign of bearishness creeping into the stock or ETF being analyzed.
 Currently the 40week FLD is providing IWM some price support. At this point in time, I’m looking for price to move up for a day or two and then roll over so to complete the formation the 80d cycle trough, which is projected to form around September 22nd. The 40week FLD may not be able to prevent a lower low from forming. If this first 80d cycle out of the 18m trough ends up being only slightly bullish that will be concerning for IWM’s longer term prospects.
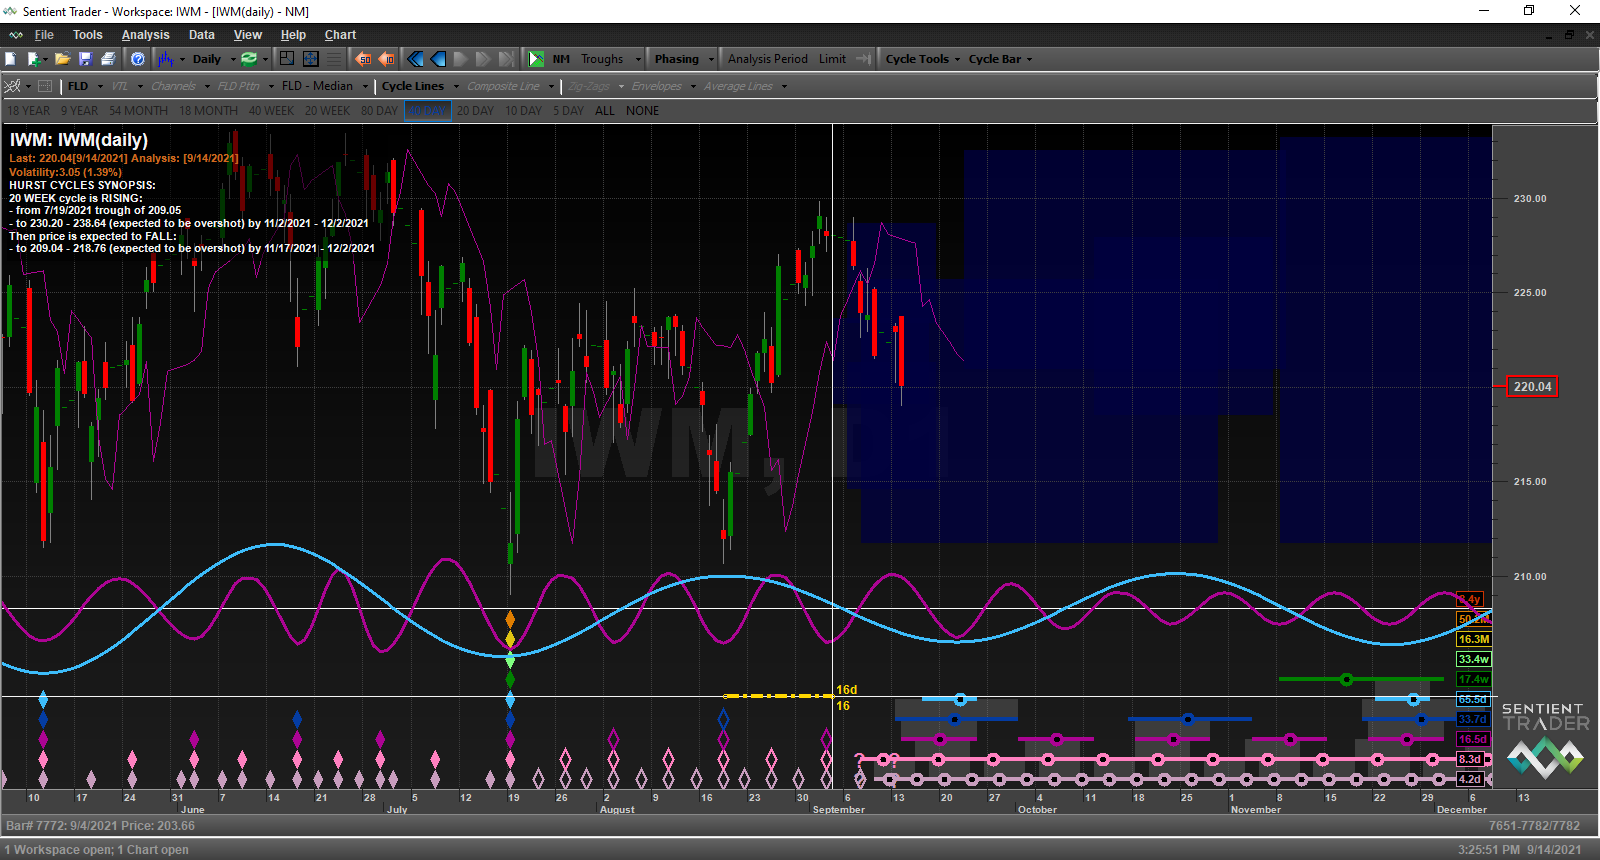
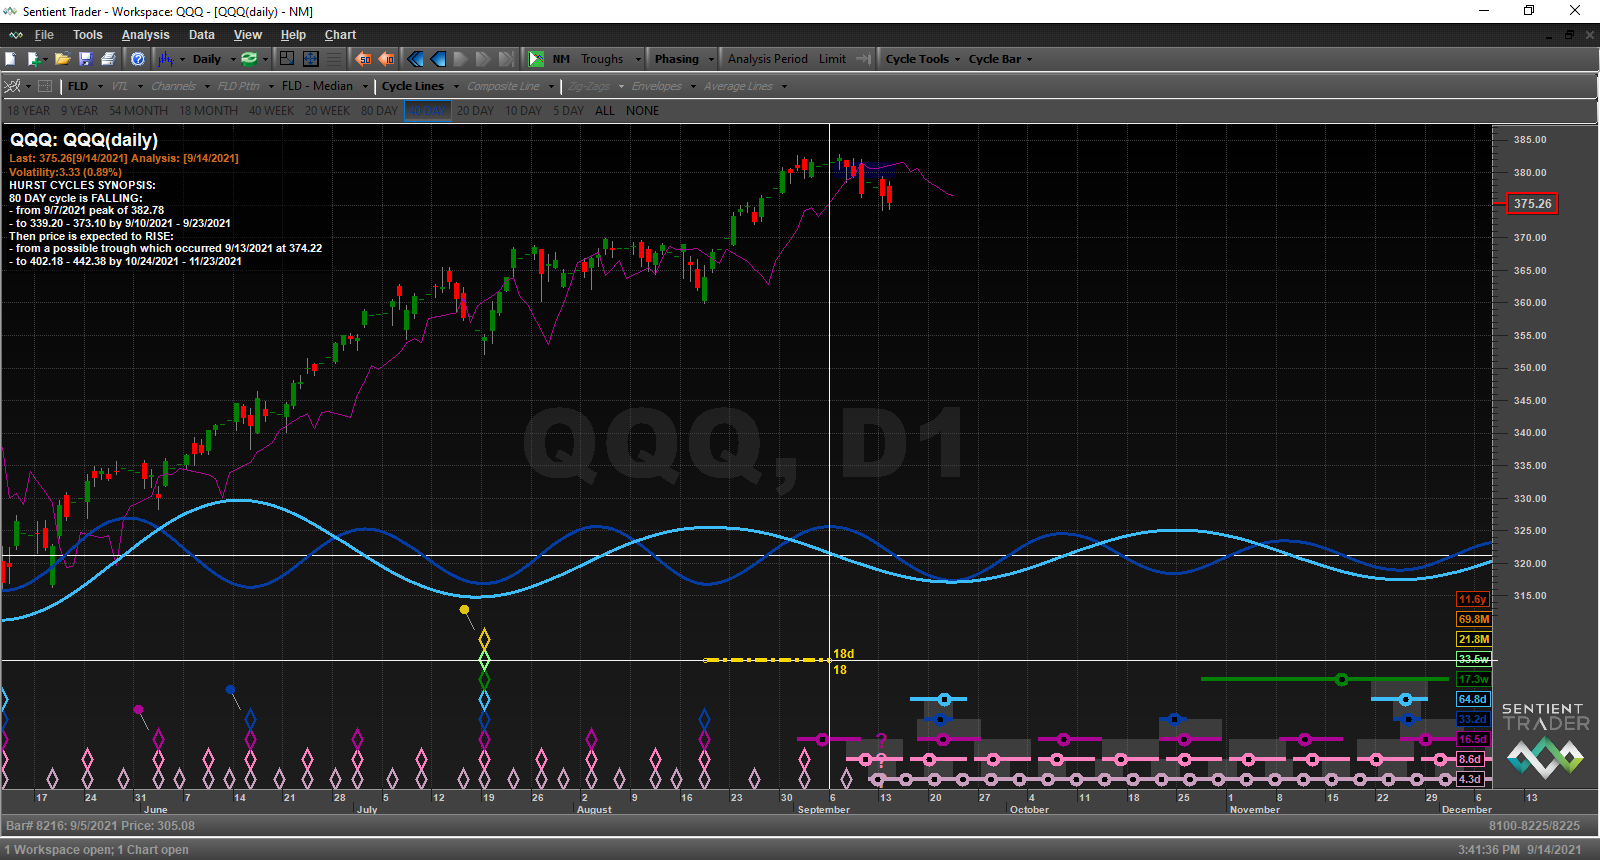 QQQ – this analysis likewise supports my earlier expectation that the 20d trough would form over the 3-day Labor Day weekend. The darker blue cycle on the chart is that of the 40d cycle. When a 40d cycle peaks, a 20d cycle trough forms. Per this analysis the 40d cycle peaked over the Labor Day weekend. There was a minor bounce up out of that trough on Tuesday, September 7th and then price on September 8th began an earlier than expected move down towards its 80d cycle trough, which is now projected to form around September 23rd. Like IWM, you can visually see that the downside target generated by price crossing down and through the 20d FLD exceeded its target. Since, price is still very close to all-time highs I don’t see this target being exceeded as that big a deal.
 Currently price is being supported at the level of the 40d FLD. However, since the 20d FLD target was exceeded, it is very likely that this FLD support will be taken out as price completes the formation of the 80d trough next week.
 SPY – as discussed in my September 3rd cyclic outlook update, I expected that the 20d cycle trough would form over the Labor Day weekend. This analysis is now providing a level of agreement with what I said then even though it is not able to place the trough during that timeframe due to the lack of data. However, it has tentatively placed the trough, per the stack of diamonds, as occurring on September 3rd. But most likely it formed on September 4th, or 5th.
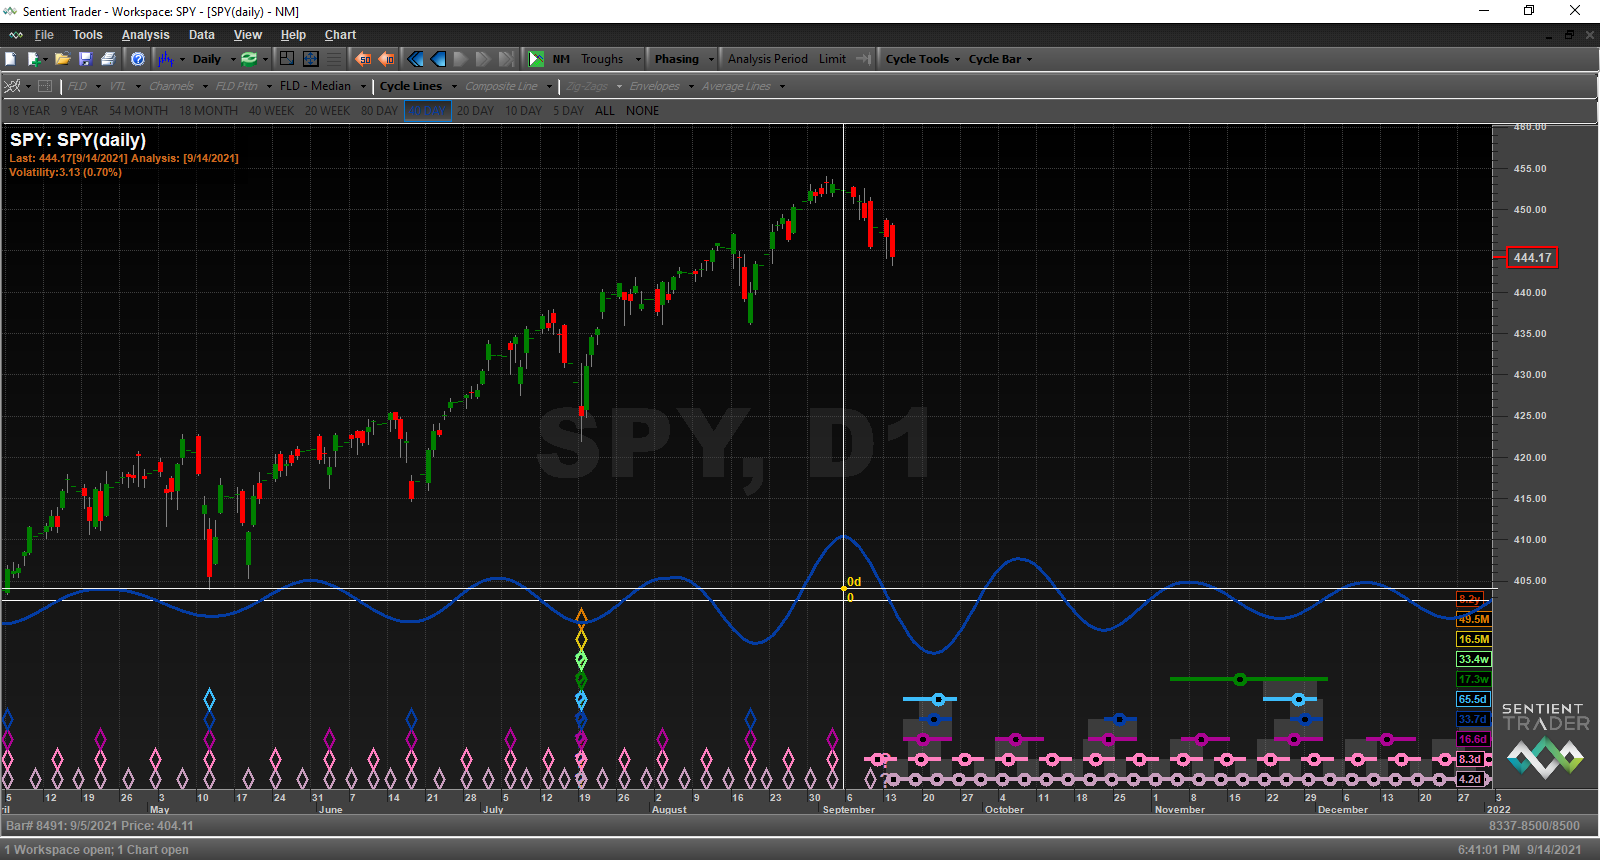 Additional support for the September 5th placement is the location of the 40d cycle peak. When the 40d cycle peaks you will have the formation of a 20d cycle trough. As you can see on the chart above, Sentient Trader’s shows the 40d cycle cresting right at September 5th.
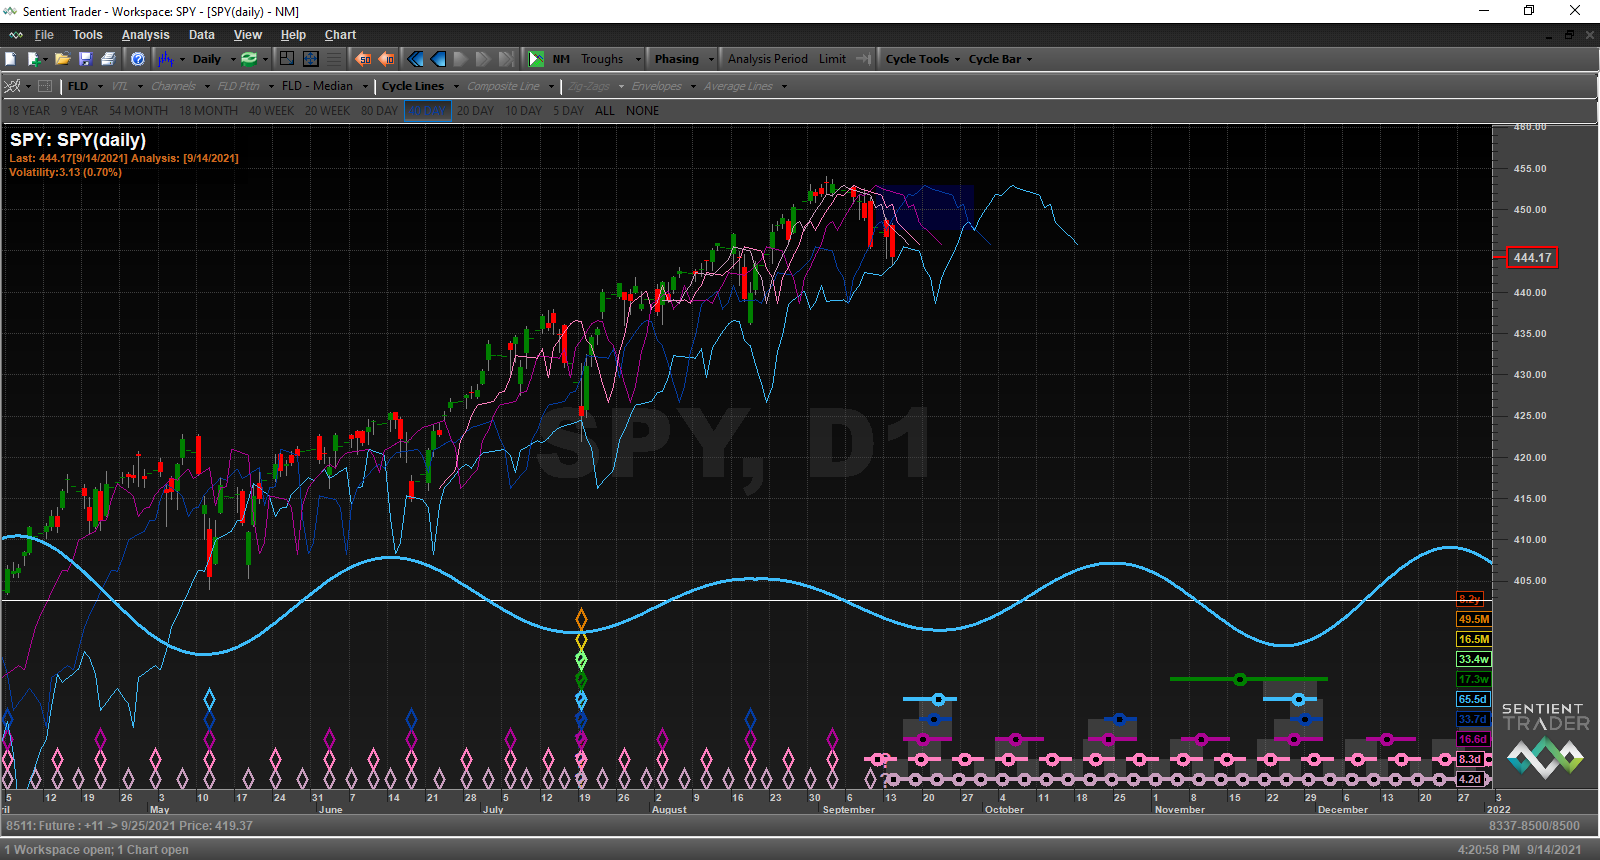 Furthermore, since price peaked on September 2nd the move down has cut through four different FLDs and today found support at the level of the 80d FLD. If I were to venture a guess, I’d look for price to move along the 80d FLD for a day or two before it starts to roll over again and finalize its move down into the 80d cycle trough.