This Cycle Outlook has been kindly provided by David Walling.
The analysis is provided for your consideration and is not to be construed as financial advice. Please bear in mind our disclaimers which apply to all posts on this site.
Please note: Any questions about the post will be answered by our team, not by the contributor.
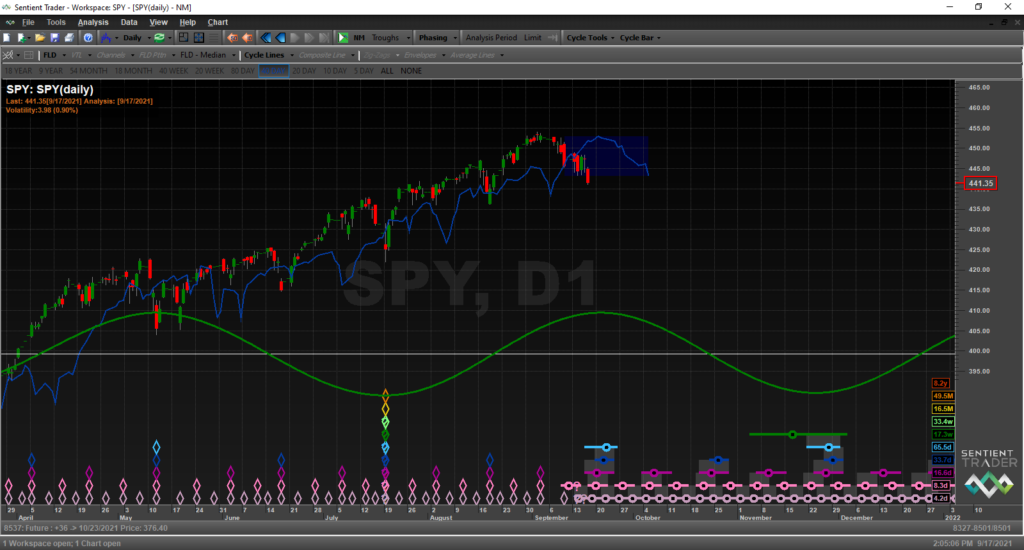
SPY is in the process of forming its 80d cycle trough at the time of this writing. I like to step back and just look at the interactions taking place with price and the 40d FLD as it moves through its 20week cycle—which is shown in green in the lower quarter of the chart.
First, when price moves out of an 18m cycle trough we’d expect it to achieve or exceed its 40d FLD target prior to the formation of the 40d cycle trough. That target was 442.53 and it exceeded it by a little over 1%.
Second, as price goes through the process of forming it 40d cycle trough we’d like to see it reach towards the 40d FLD, find support at the FLD and then bounce up from it. It came very close to doing that. However, it did cut down through the FLD for one day before bouncing strongly out of that trough. This is still bullish, but could have been interpreted as indicating a little bit of weakness was creeping into the price action.
Third, as price moves out of its 40d cycle trough we’d expect it to achieve new highs. It did so quite easily. Once again, placing things back on the strongly bullish side of the ledger.
Fourth, as price forms its 80d cycle trough, we’d expect price to cut down through the 40d FLD and considering that it is the first 80d cycle after the formation of the 18m cycle, we’d look for price to not achieve its downside target. As I write this, on Friday afternoon September 17th, it has already slightly exceeded its downside target of 441.65. With the 80d trough not expected until around September 21-23 and with next week historically being one of the most bearish weeks of the year. This is a concern.
However, right now 60 days have passed since the 18m trough formed on July 19th and the 80d cycle trough could be forming as I write this. So, if there is a strong bounce up on Monday, September 20th, supported not only by price action but also with strong market internals. That could very well tell us an early 80d cycle trough may have formed between Friday September 17th and Sunday September 19th. If that ends up being the case it puts everything back on the super bullish side of the ledger.
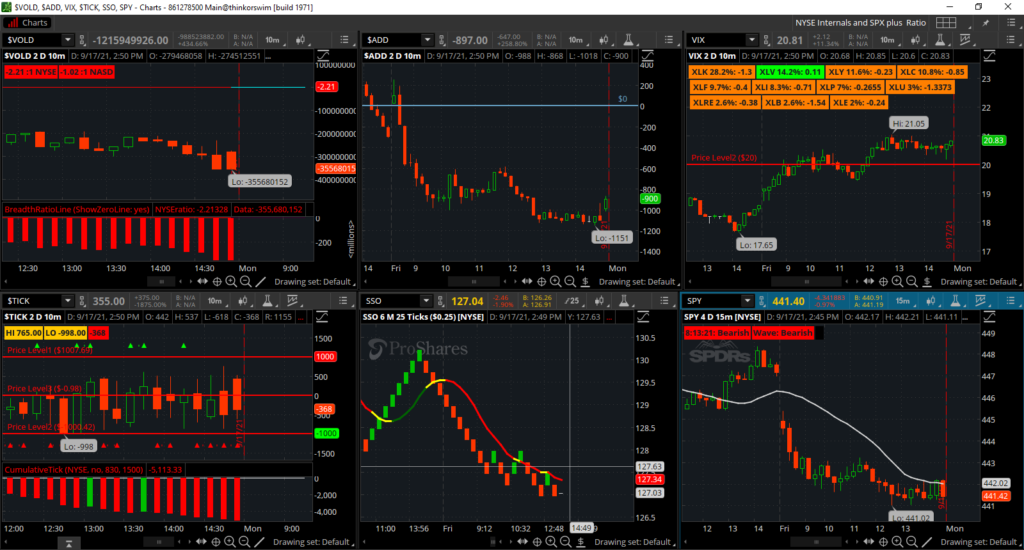
So, Monday I’ll be closely watching not only price action but the charts below to get a sense if the trough has formed or if there is going to be a bit more downside price action before that happens.
Regardless of where price opens on Monday for me to get a sense if the trough has formed or is forming, I’ll be looking to see if the:
- $VOLD, which is an up volume to down volume ratio, eventually gets to a positive reading of like 4:1 or better and that it improves as the day progresses.
- $ADD, which is a reading of advancing stocks vs declining stocks on the NYSE, can eventually reach +1200 or more and improve as the day progresses.
- VIX starts to plunge and then close near it’s low. And in the same quadrant, if most the sector ETF boxes are green at the end of the day. Which would indicate that from the open each had an increase in price.
- $TICK, majority of the candle bodies form mostly above the zero line with numerous candles closing above the 600 level. I’d also, like to see the ticks surge over the 1000 level several times during the course of the day. I’d also like to see a large number of green triangles forming over the top of tick bars which will indicate that most of the 10-minute candle bodies closed above the zero line. Finally, I’d like to see the cumulative tick histogram have a lot of green bars form above the zero line and that the bars become progressively larger as the day progresses—pretty much the total opposite of what occurred today.
- Finally, I’d like to see each of the index’s gain one percent or more on the day and close near their highs. If I see this kind of price action occur supported by strong internals, then I’ll have a pretty good idea that the 80d trough has formed even before we get cyclic confirmation signals. I really can’t wait to see how it plays out next week.


