This Cycle Outlook has been kindly provided by David Walling. (In case you missed the announcement about this new series, read this)
The analysis is provided for your consideration and is not to be construed as financial advice. Please bear in mind our disclaimers which apply to all posts on this site.
Please note: Any questions about the post will be answered by our team, not by David Walling, who has generously contributed his time (this is not a sponsored post).
Greetings, a little more detailed look at the IWM and SPY as we come into the weekend and what I expect to see happen between now and early next week. Have a good weekend.

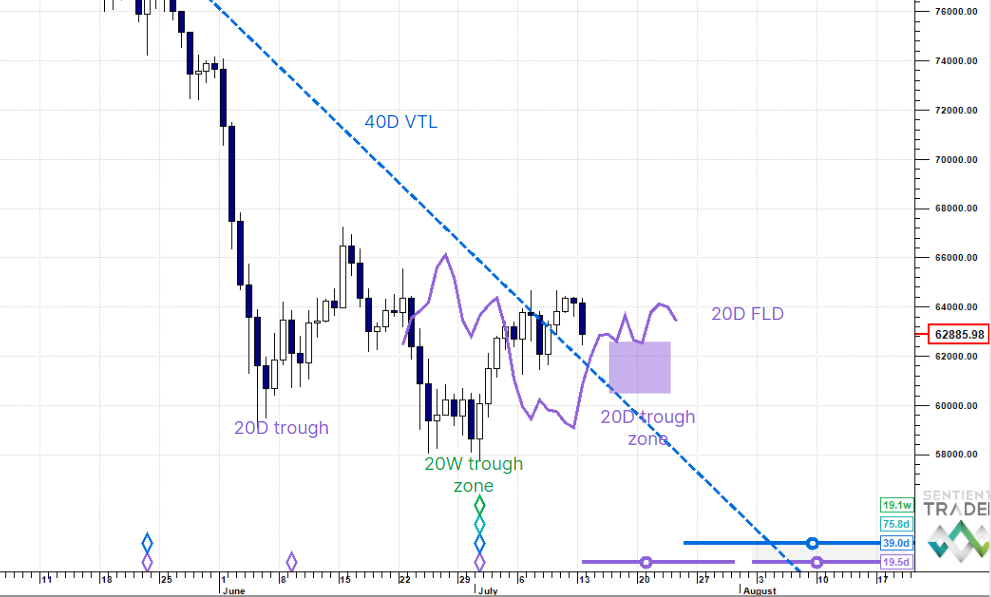
IWM – getting first test of price interacting with its 20-day FLD. I’m looking for a 5-day cycle trough to form tomorrow and a break above the 20day FLD early next week. Would not want to see price pull back below the 10-day FLD (pink)—that would not be good. But unless the July 19th low is taken out the odds are that the 18-month trough has formed.
IWM chart without the 10 and 20-day FLDs and just the Composite Line.
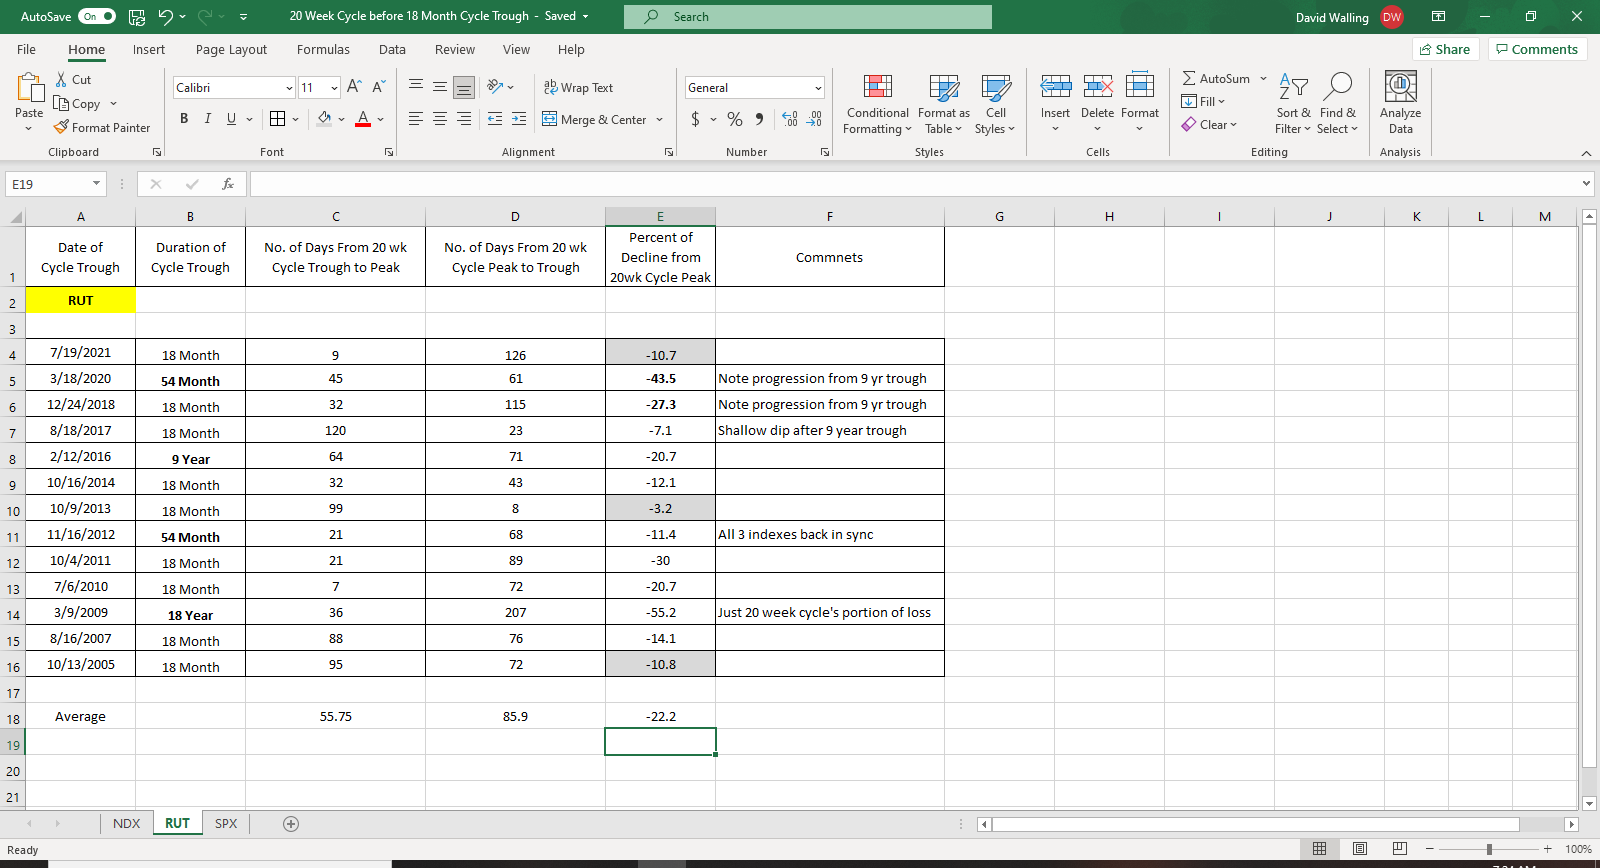
RUT – as you will see this index had the worst of it by experiencing nearly 3 times the losses experienced by NDX and SPX. Also note that it formed its 20 week cycle peak a mere 9-days after the formation of the 20-week trough on 3/5/21.
IWM – if you look at it from a different perspective what you see is price contained in a multi-month Darvas Box. A breakout over the top of that box is what I’m expecting to happen–if the Composite Line forecast is even remotely correct. Since, markets tend to move from trend to balance to trend, an upside move out of that box would suggest that a new multi-month trend could be expected.
Since the March 2020 low represented a trough of at least 54-month magnitude, I expect the breakout to be to the upside since we are still on the bullish or upward side of the 54-month cycle and the move out of the July 2021 trough will only be the start of the second of three 18-month cycles. Therefore, I’d expect at a minimum at least another 7 to 12 months of overall upside price action.
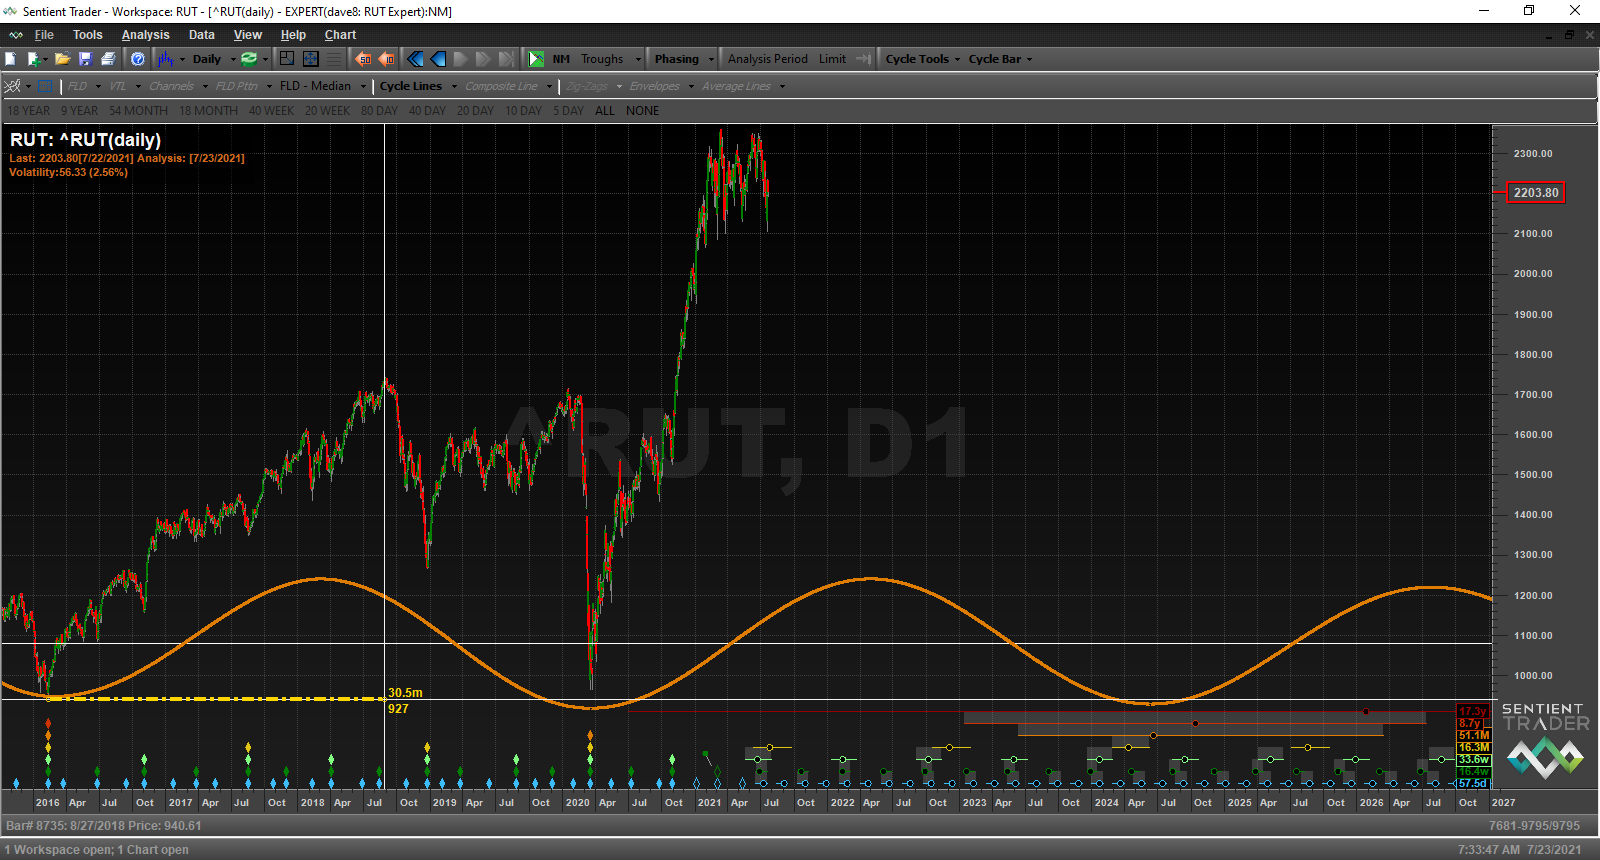
RUT – here’s what I mean. The last time a 54-month trough formed the bullish move out of that trough last 30.5 months. However, that was also a move out of a 9-year rated trough, so this bullish run most likely won’t be as long since the 18-month and 9-year cycles are now both moving downward. Regardless we should have a nice runup out of this new 18-month cycle trough. The same can be said for NDX and SPX.

NDX – is already touching its 20-day FLD. Note that the timing for the 20-week trough was nearly perfect with the nominal length being 19.48 weeks. Since this was the final 20-week cycle of the 18-month cycle it represents the 18-month cycle low as well.

Currently Sentient Trader is projecting very good things for this index.
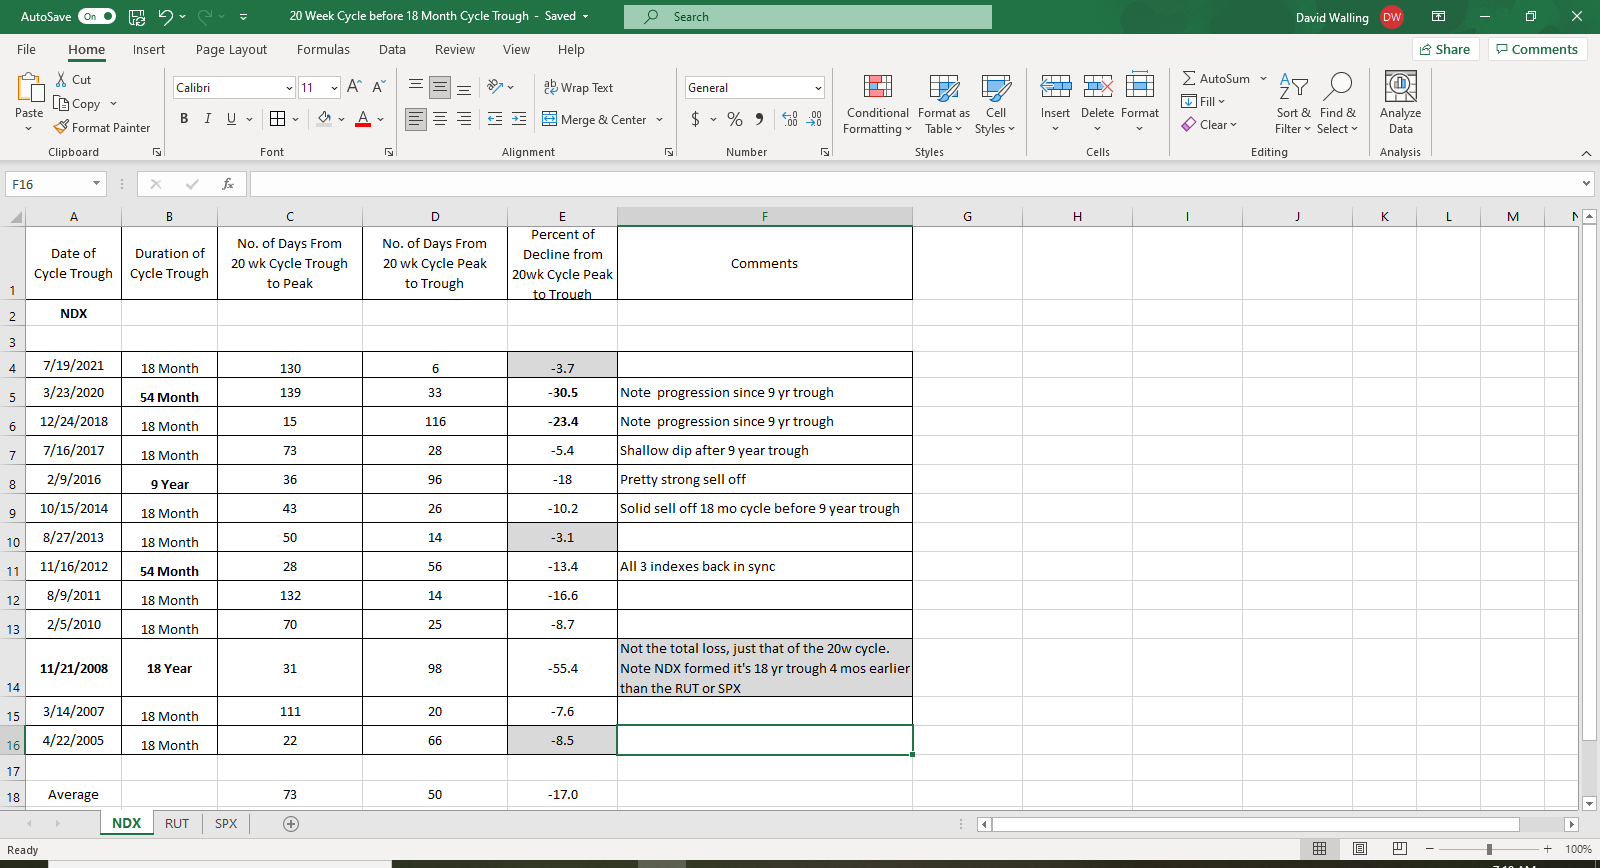
The percent pullback into this 18-month cycle trough was shallow but not much different than the one experienced in August of 2013 which was also the first 18-month cycle trough after the formation of a 54-month trough.
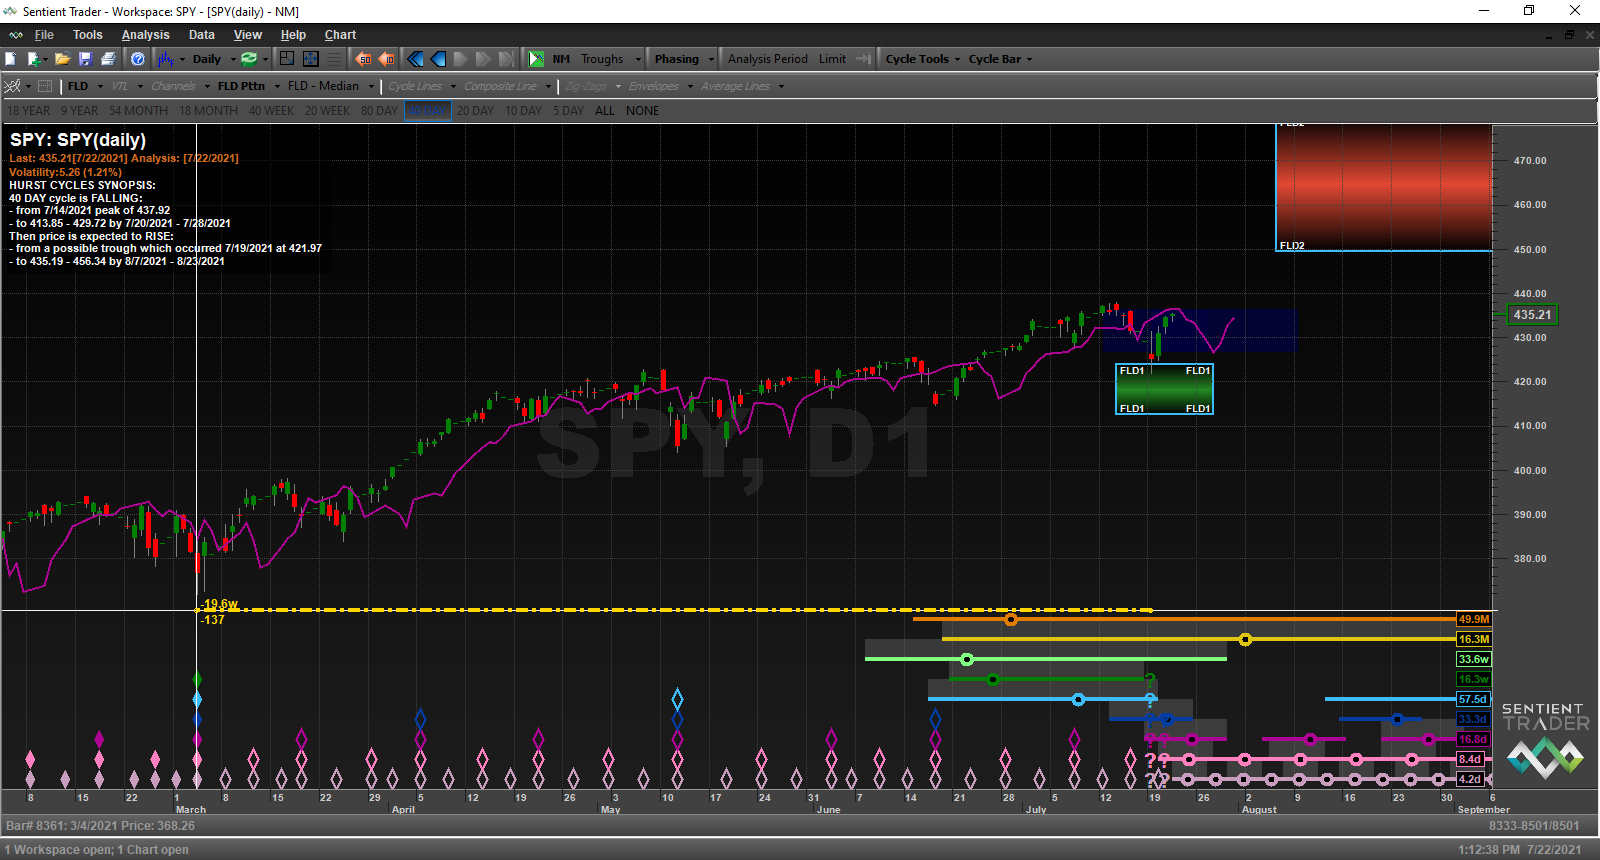
SPY – today we see price slowing down as it works its way through the stickiness of a Pause Zone (dark blue area on chart). Note it is also approaching the 20-day FLD from below. If you look at the lower right-hand corner of the chart, you’ll see that a 5-day cycle has been occurring about every 4.2 days – the nominal for this cycle is 4.3 days, so almost perfect. Friday, July 23rd will be 4 days since the proposed 18-month cycle trough formed. I anticipate a minor pause or pullback tomorrow and then I will look for price to punch above the 20-day FLD and out of that Pause Zone early next week. Such a move will provide a certain level of cyclic confirmation that the 18-month trough did form on July 19, 20201.
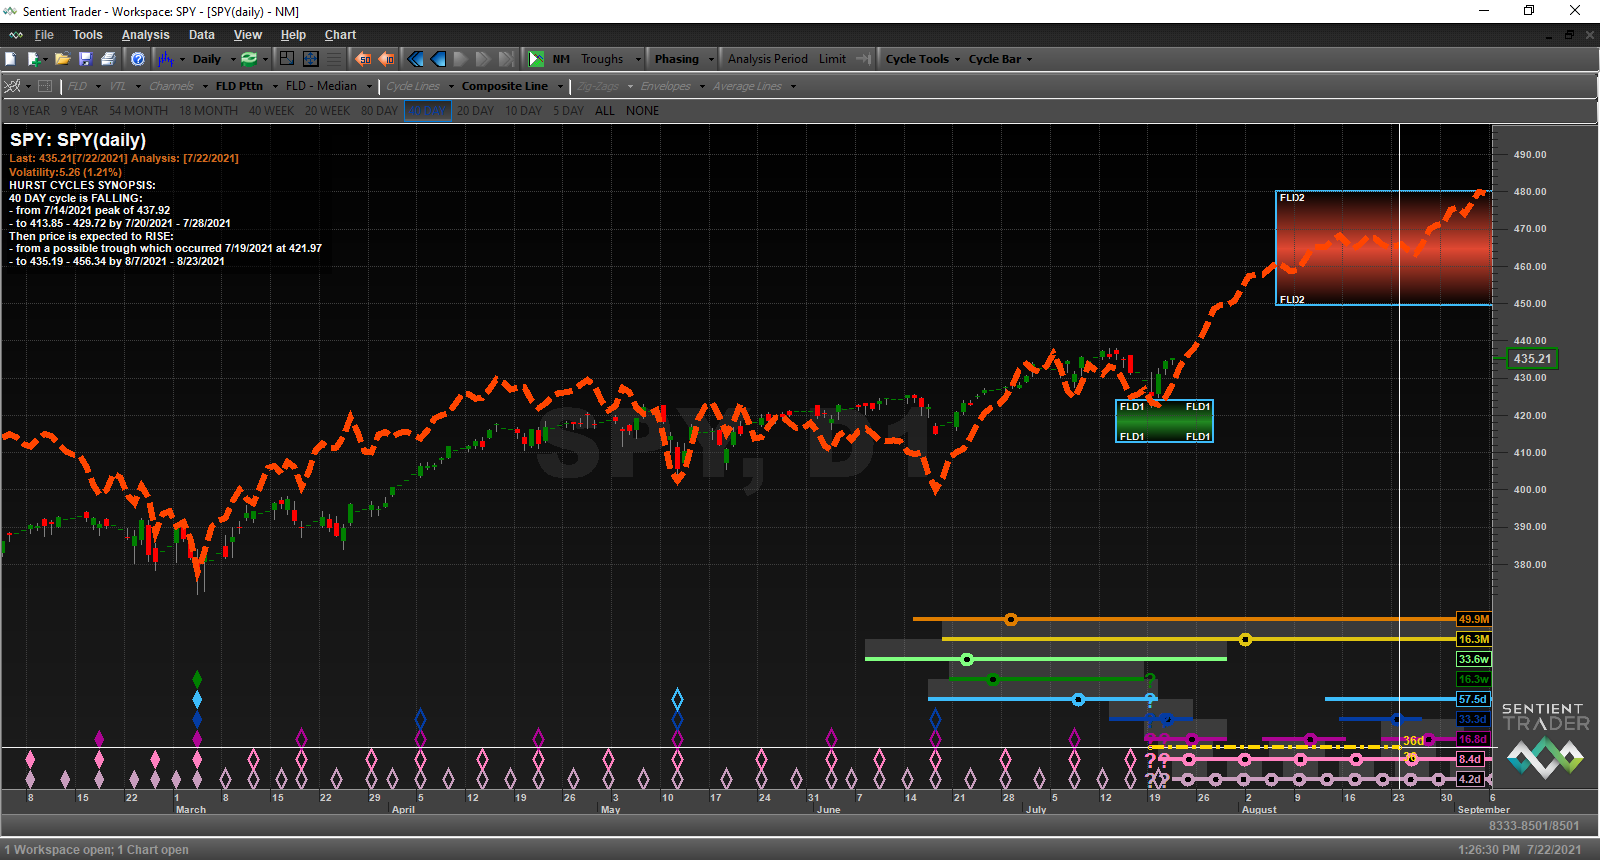
Here again Sentient Trader’s Composite Line is projecting bullish market action as price starts to get moving out of the 18-month cycle trough.
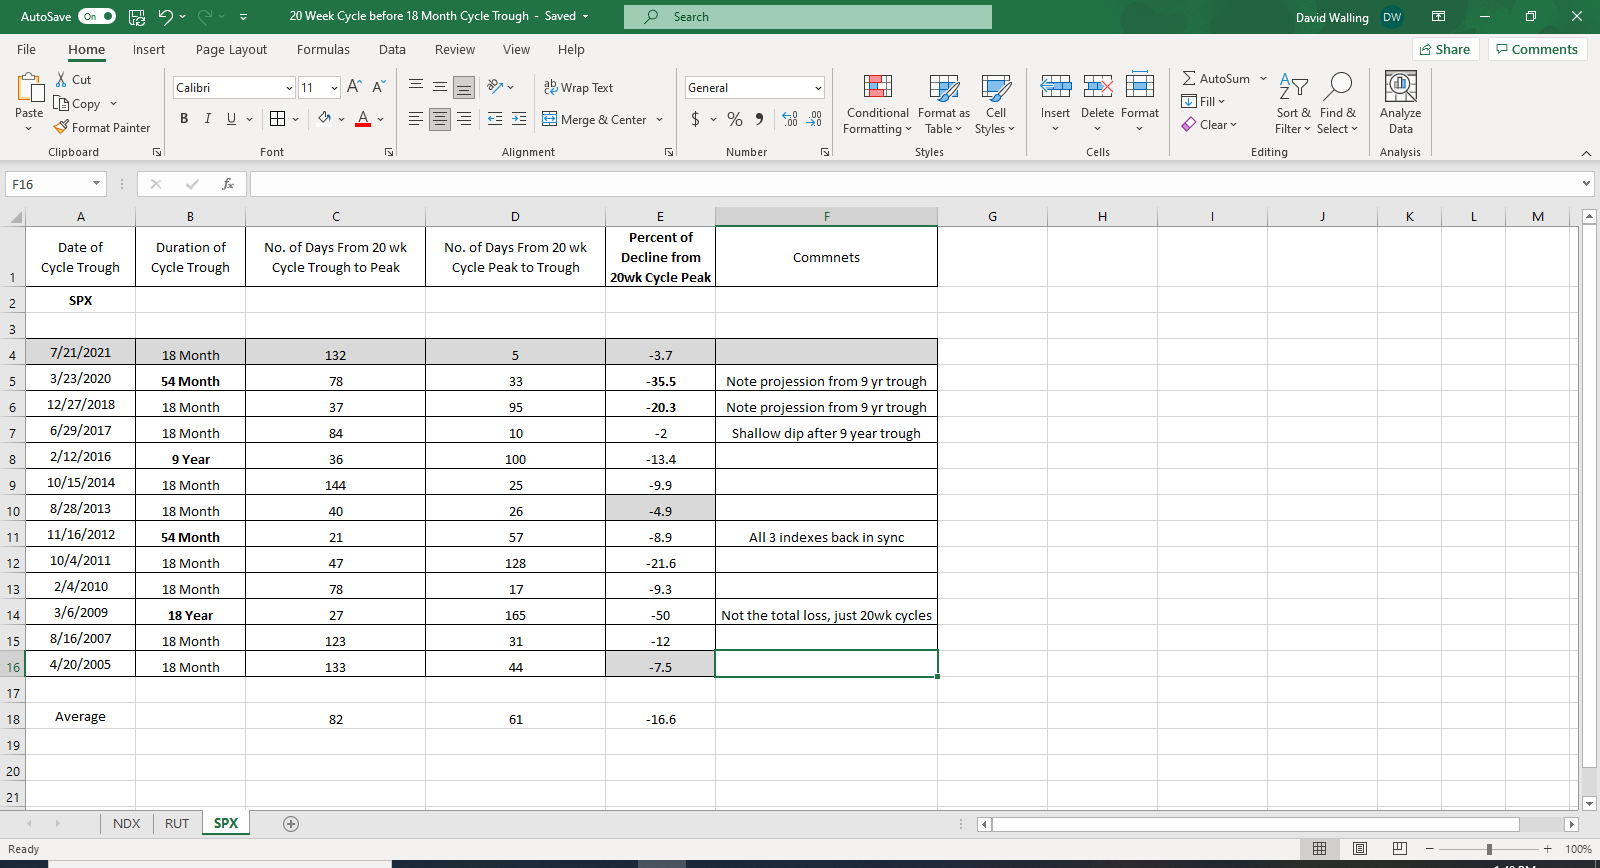
SPX – if we compare this 18-month cycle to others occurring after the formation of a 54-month cycle trough it is fairly comparable. If in fact July 19th did represent the 18-month cycle low, then the pullback into the trough was shallow but so have the pullbacks at other times. Considering the amount of unprecedented fiscal and monetary stimulus the shallowness of the pullback is more understandable. But it sure does make this cycle analysts feel dumb since I was expecting that we’d see an average pullback of around 16%. So, if in fact it turns out that the trough has formed, that clearly did not happen. It also shows that one can easily manage the first pullback into the first 18-month cycle trough after the formation of a 54-month trough. I guess I should have studied my own data a bit closer which, as shown above, would have suggested the pullback to be somewhere around a 5 to 8%.