This Cycle Outlook has been kindly provided by David Walling.
The analysis is provided for your consideration and is not to be construed as financial advice. Please bear in mind our disclaimers which apply to all posts on this site.
Please note: Any questions about the post will be answered by our team, not by the contributor.

VIX – Sentient Trader is looking for a 20d cycle peak on Sept 4th. The composite line shows the VIX pulling back next week and then starting to go back up again the week after. Right now, it’s projecting an 80d cycle peak around Sept 22nd. This projection is perfectly correlated to when the indexes are projected to form their 80d cycle troughs.
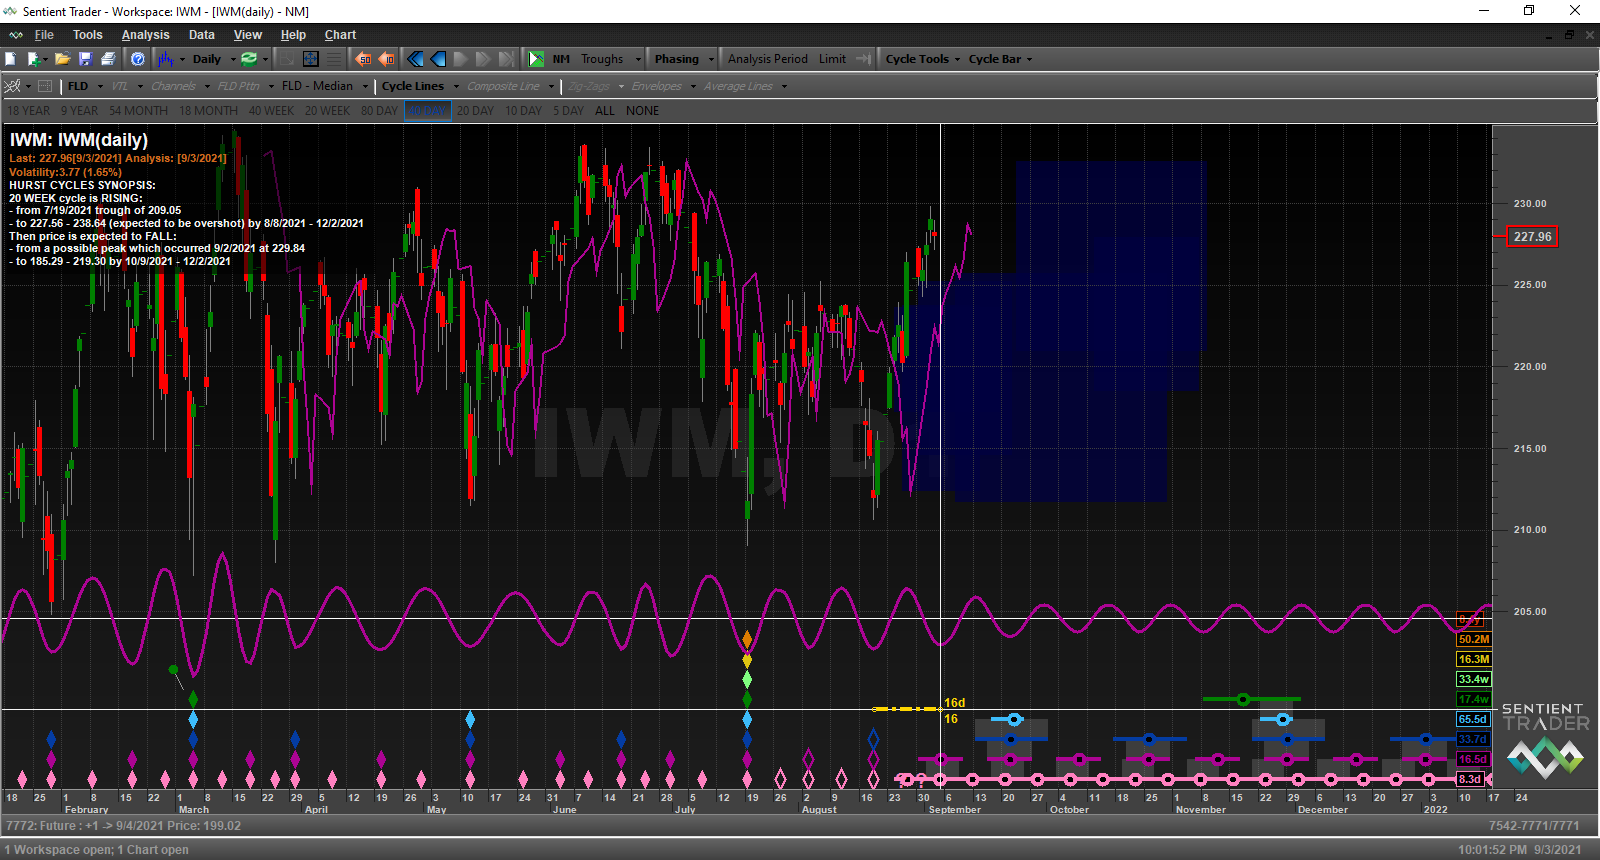
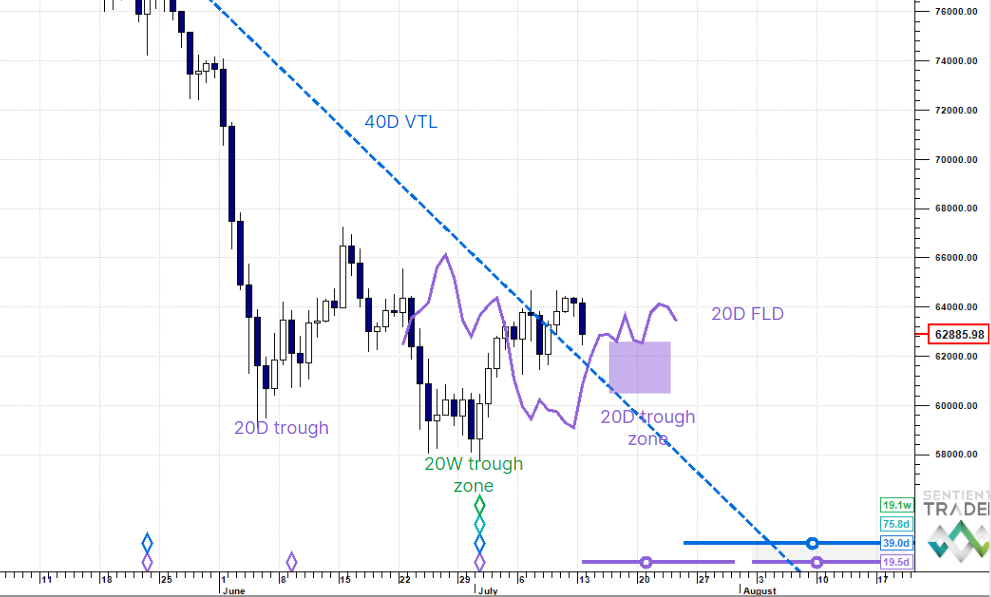
IWM – most likely the 20d cycle trough will form between now and Tuesday, September 7th. Since May 12th, IWM’s 20d cycle beat has averaged 16.5 days. But with every average there are extremes. For IWM the longest 20d cycle was 22d and the shortest was 11 days. So, even if we do open lower next Tuesday the 20d trough will still occur within that range. One way or the other since there is a weekend and a holiday this Monday in the United States, the 20d cycle line will lose a little of its visual perfection.
We must always remind ourselves that cycles are constantly in motion even during the periods of time when the markets aren’t open. If the markets were open cyclic influences would most likely result in price moving down to and most likely through the 20d FLD—just like you see with the formation of every other 20d cycle trough on the chart. This is my 10th year doing cyclic analysis with Sentient Trader and I’ve seen these phenomena take place repeatedly.
It appears that some cycle analysts get caught in the trap that the final 20d cycle trough, before the formation of the 80d cycle trough, must be clearly recognizable and needs to show a clean move down through the 20d FLD—because that’s what’s expected. However, when the 20d trough is expected to form during a regular or long holiday weekend, that move through the 20d FLD can occur, and a recognizable trough can form, without it visually showing up on the chart.
Many will think I’m crazy now and that’s your prerogative, but as cycle analysts there is reality and then there is cyclic reality. What I’m discussing here is cyclic reality and sometimes that world of reality doesn’t show up on our charts. Why because the cycles move 24hrs per day, 7 days per week whereas price action in the US markets occur 6.5 hours per day but five days per week and sometimes only four days per week. What is real, is that Sentient Trader tries to make cyclic sense out of what’s going on with less than 18.6% of the yearly cycle’s movement data available to it. Think about it, there are 8760 hours in the typical calenda year, but the markets are only open 252 days or 1638 hours—18.7%. So being an analyst is not only a scientific endeavor but an art form because the analyst must sometimes help Sentient Trader determine what’s taken place during those periods of time when the markets aren’t open. That’s why David Hickson and his team developed the pinning tool, so he and the rest of us can perform our art. I know some people think if you’re pinning, you’re somehow cheating and that just letting Sentient Trader do its thing will result in a superior analysis—rarely have I found that to be true. The reality is that when you use your knowledge and insights you’re helping Sentient Trader, make better use of the limited data that it has available to it. In this case two brains are better than one.
This phenomenon can also mess up Sentient Traders analysis. Often, it will not be able to locate this coming 20d trough until the 80d trough is confirmed—sorry but that’s just the way it works out sometimes. When Sentient Trader can’t place this trough, due to a lack of price data from those non-trading days, cyclic analysts often get fooled into thinking that the 20d trough hasn’t formed yet and the cycles are now just becoming stretched out. Hence, they lose track of the cycle beat and miss the correct sequence of trading opportunities. This is something every analyst needs to be aware of.

QQQ- everything that I discussed for IWM is ditto for QQQ. The average 20d cycle beat for QQQ since May 12th has been 16.5 days with 22 days being the longest and 13 days being the shortest. Based on QQQ maintaining its current cycle beat, Sentient Trader is projecting that the 80d trough will form around September 22nd. The same date Sentient Trader is projecting the VIX will form its 80d cycle peak. Too different ways of looking at the markets leading to the same assumption.
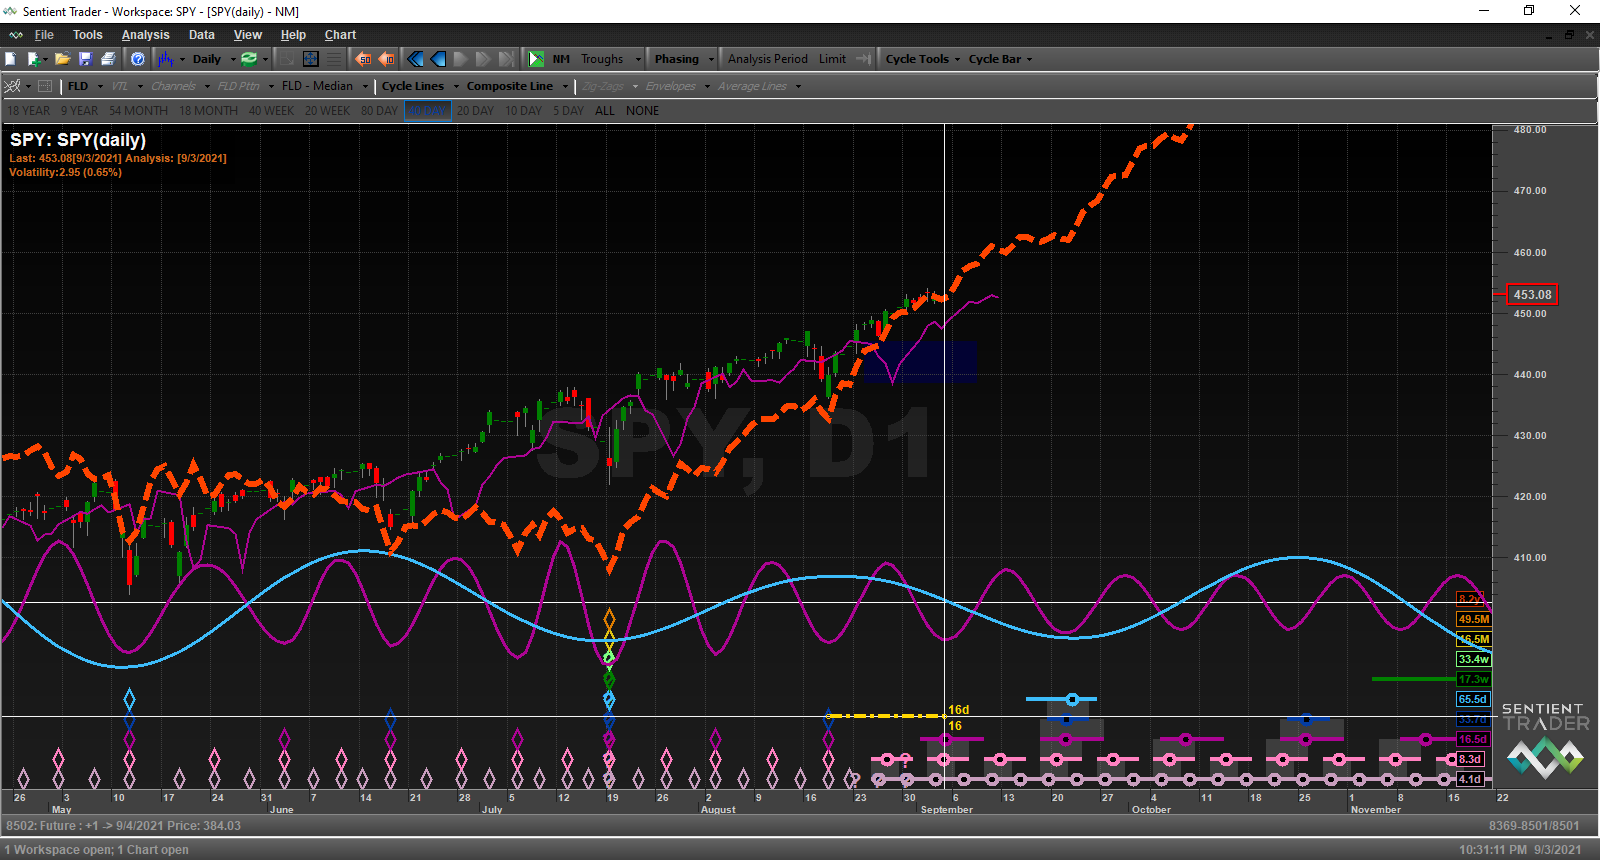
SPY – it too is showing the same timing for the 20d cycle trough as with IWM and QQQ. The average 20d cycle beat for SPY since May 12th has been 16.3 days with 22 days being the longest and 14 days being the shortest.
Remarkably, the Composite Line developed by Sentient Trader and shown on the chart as an orange line, has been consistent in its projection of price movement, and it has been correct. The VIX analysis, shown earlier, calls for volatility to pull back this coming week and then start to move up again the following week. Whereas the Composite Line for SPY says price should move up this week and then start to go more sideways during the formation of the 80day cycle trough. So far it has been right on the money, as amazing as that sounds. Will this perfect tracking of price action continue, I have no idea but since the formation of the 40d trough on August 19th, it has been spot on. So, kudos to David Hickson and his team for making this feature of Sentient Trader available to us.