You will come across specific terms in these notes (FLD, VTL, and so on). Rather than explain them each time, you will find definitions here: guidance notes for Hurst cycles terminology
Ethereum – in a new 18 month cycle upswing, but near term barrier approaching.
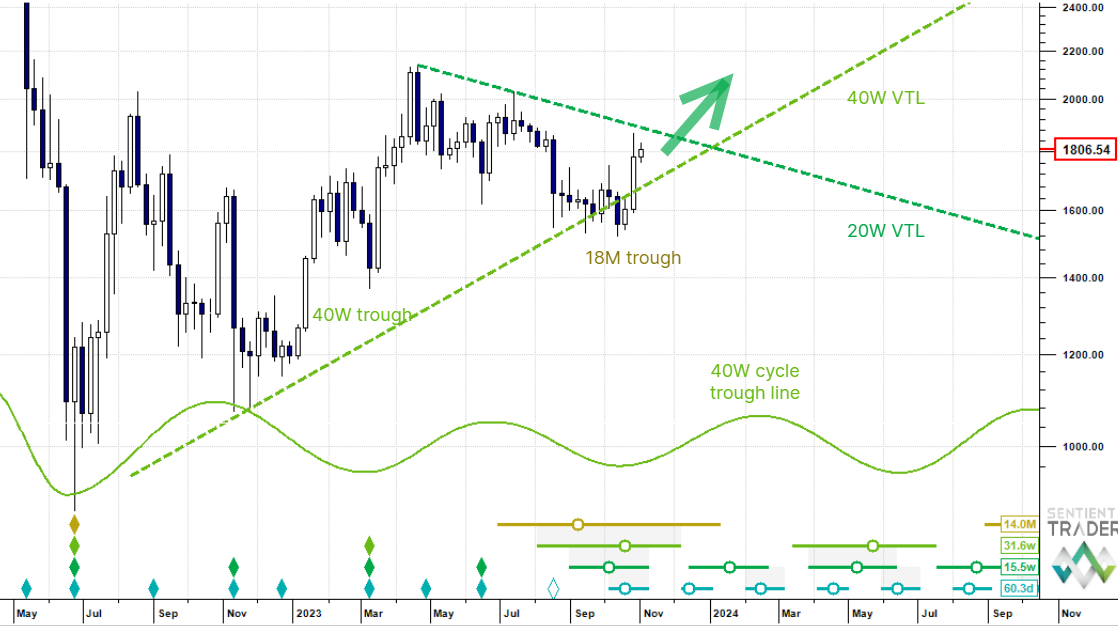
Weekly analysis: we think that the recent trough was at 18 month cycle magnitude, which points to more upside follow through. Notice that this phasing analysis places the last 40 week cycle trough (in March) somewhat unorthodoxly, we would expect it to be lower than the previous 20 week cycle trough (last November). However, this gives us a much cleaner analysis and more acceptable wavelength for the 40 week cycle. As we will see in the daily analysis next, this pattern has been mirrored at the 40 day cycle degree. Just above price here we see the 20 week VTL, which is a clear liquidity magnet but the takeaway in today’s note is that a successful challenge should occur with the new 18 month cycle as a tailwind.
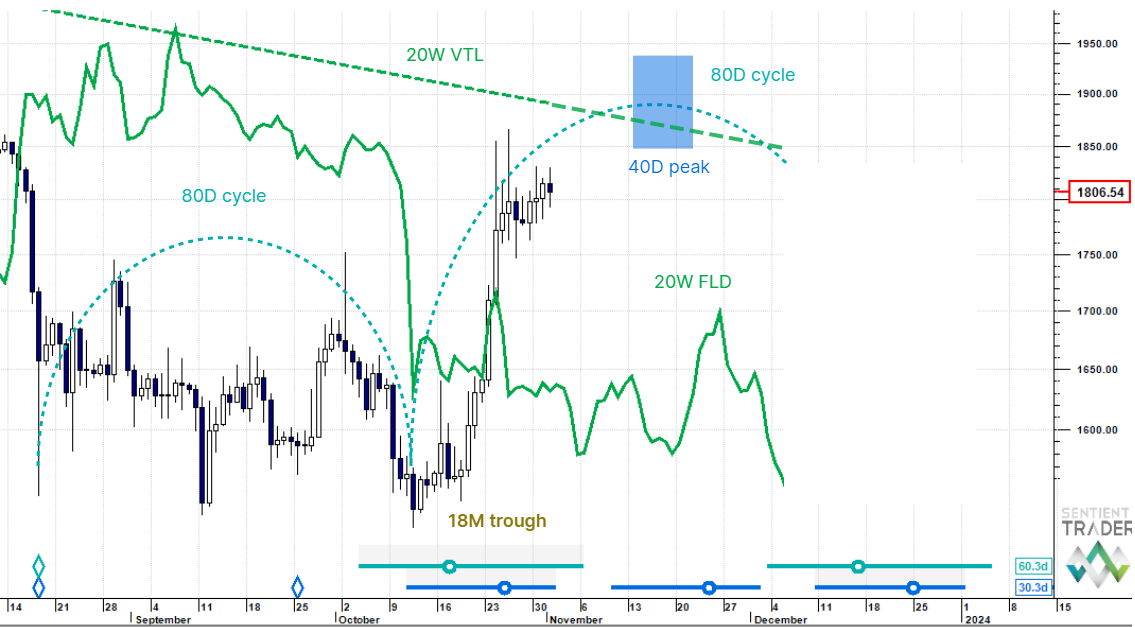
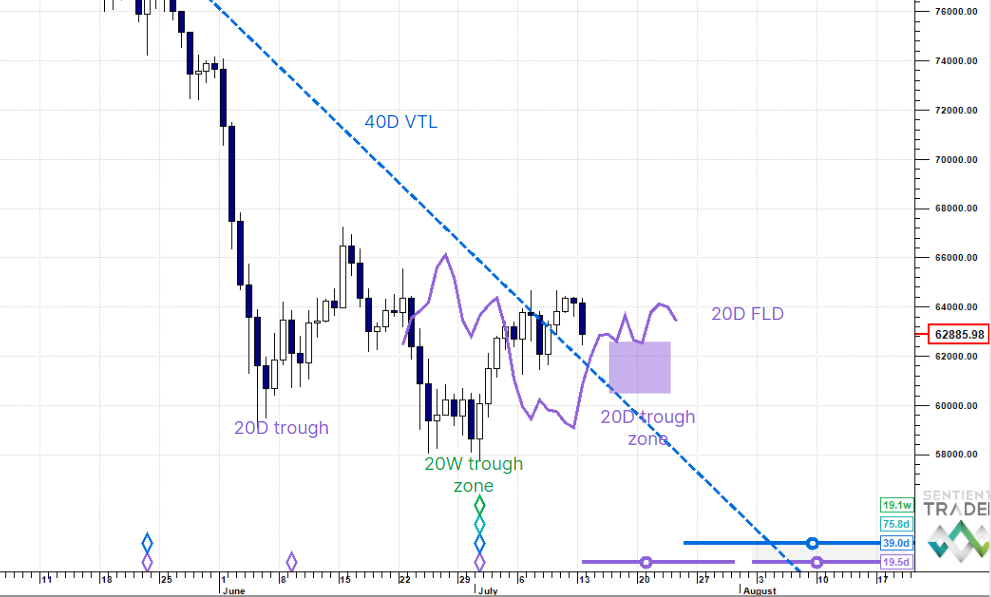
Daily analysis: the 18 month cycle phasing circle at the bottom of the chart has been omitted for clarity, and the light blue 80 day cycle trough is standing in for it here. The 20 week FLD was crossed up in October and projects in a neutral market to 1,836. Its not a neutral market though, the new 18 month cycle underpinning price action should see an upside overshoot of the FLD target. However we can still use the base projection because it more or less corresponds to the 20 week VTL we looked at on the weekly. So what we are tracking for now is the first 80 day cycle and specifically the component 40 day cycle peak, which is due higher after mid-November. Notice the dark blue 40 day cycle trough diamond on 25 September and how the trough was higher than the prior low on 11 September. This is the same pattern we saw in the 40 week cycle.
This post was first published on Hurst Cycles Notes.