You will come across specific terms in these notes (FLD, VTL, and so on). Rather than explain them each time, you will find definitions here: guidance notes for Hurst cycles terminology
Nifty Index – in 18 month cycle trough zone..
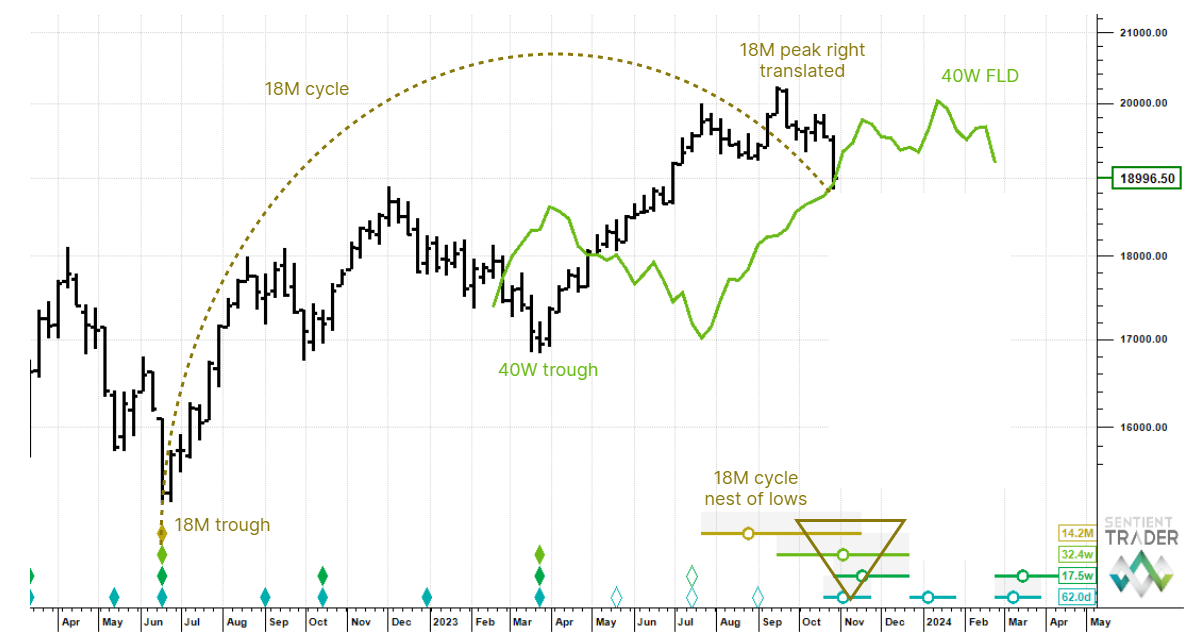
Weekly chart. The long term chart shows potentially the full arc of an 18 month cycle. An 18 month cycle trough is due soon, which should see a meaningful bounce. We have not had confirmation yet, so the main takeaway from the weekly analysis for now is that downside risk is limited. Notice also a few more things: the 18 month cycle peak is heavily right translated (late) which speaks to a longer underlying uptrend component – we can also see that the 40 week FLD was crossed up in April and the upside target was significantly exceeded, which is bullish; price is now testing the 40 week FLD again, which at this stage of the cycle points to potential support.
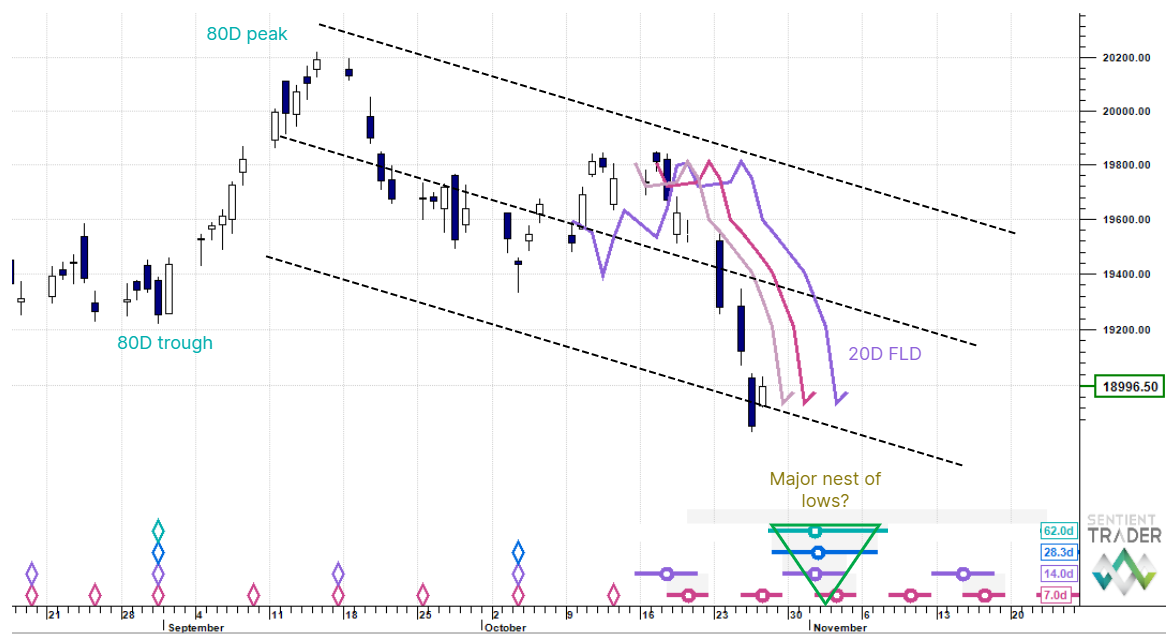
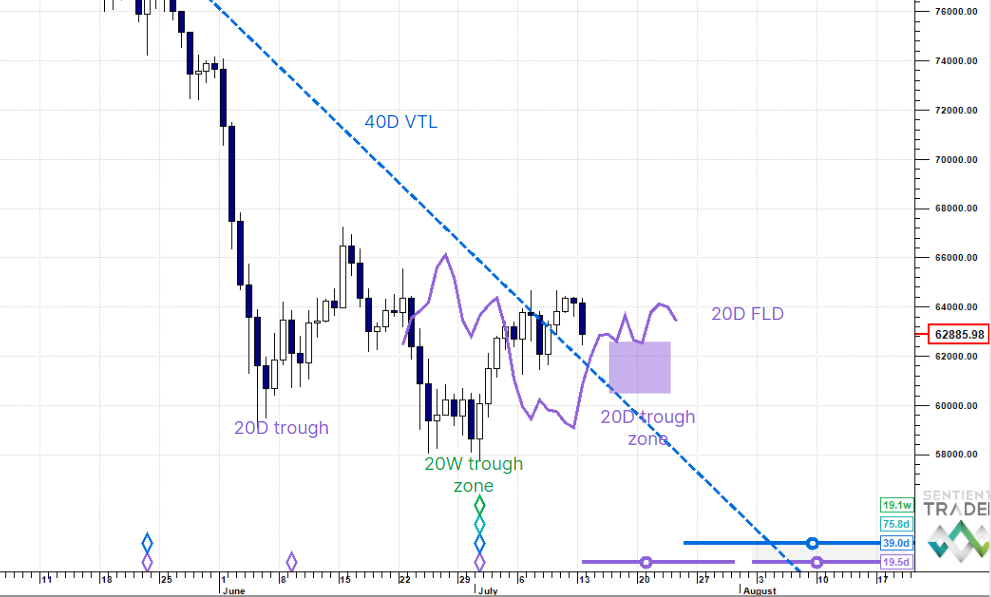
Daily chart. We are looking at the 80 day cycle nest of lows here being the shorter component cycles of a much larger cycle trough (see weekly analysis above). The outer range is the end of the first week of November, so there may yet be some downside play, but we think price is in the zone. Notice also the down-sloping regression channel – the 2 standard error lower boundary now being tested. The short cycle FLDs from 5 to 20 days are running in parallel in a cascade pattern which should serve to suck price up into them once the low is in place.
This post was first published on Hurst Cycles Notes.