You will come across specific terms in these notes (FLD, VTL, and so on). Rather than explain them each time, you will find definitions here: guidance notes for Hurst cycles terminology
TASI – has the 80 day cycle bottomed here?
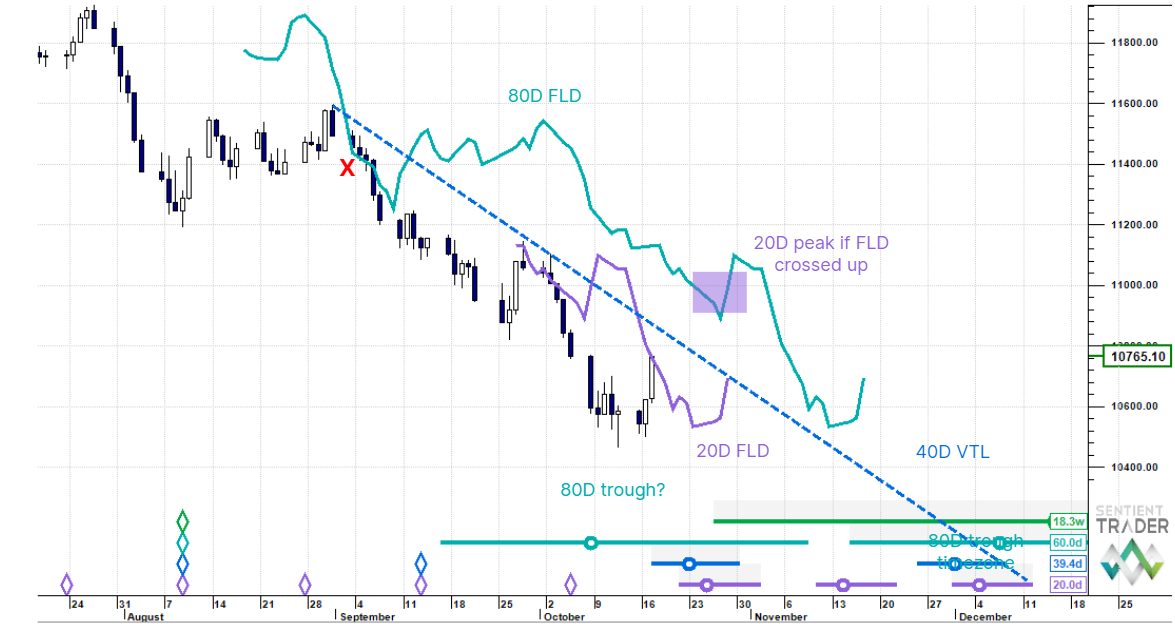
TASI has been skating along an RSI oversold condition since the last week of September and just posted a reasonably tight bullish divergence 9 to 15 October. The leg down from the end of August is 150% of the first leg down from end July to the first week of August. This Fibonacci extension should be afforded some respect. Additionally the 12 October low is extended at 2 standard errors below the July downtrend regression mean and marks the top of the February to March base. Potentially therefore this is snap back territory so lets look at the cycles to see what’s happening beneath the surface.
The last 80 day cycle trough was posted at the 20 week cycle trough on 9 August, which is 64 days before the 12 October price low. The average wavelength of the 80 day cycle here is 60 days, so the cycle trough was overdue at this point. Price has rallied into the 20 day FLD and this could very well serve as local resistance. However, if there is a full retrace (i.e failure) here, then we need to account for that 80 day cycle trough and it starts getting difficult to push it much further into the future, so we like the 12 October low for the 80 day cycle trough.
If median price penetrates up through the 20 day FLD, the preferred view, then we have a projection up to the 80 day FLD circa 11,055. At this point we would expect a pullback and perhaps even a meaningful one at this stage in the longer cycles. There appears to be an embedded downtrend component inasmuch as the 80 day FLD down cross in early September projected to only 11,000 and price has significantly overshot to the downside (to 10,466). This downwards force we should assume will work against the current rally as a headwind. For now though, we are looking higher.
This post was first published on Hurst Cycles Notes.