This Cycle Outlook has been kindly provided by William Randall.
The analysis is provided for your consideration and is not to be construed as financial advice. Please bear in mind our disclaimers which apply to all posts on this site.
Please note: Any questions about the post will be answered by our team, not by the contributor.
There are are two approaches to cyclical analysis based on the work of Hurst. The first is the numerical analysis approach employed by Hurst in Profit Magic. The second is the so called “pattern recognition” approach employed by Sentient Trader. There are differences of course but fortunately the results are usually very similar. I subscribe to the numerical analysis approach but for those who lack the programming skills, Sentient Trader is an excellent alternative.
As with any algorithmic approach to analysis, the most important factor is the user input. With ST I’ve found those to be one’s nominal model and the selection of the analysis period. In the charts below my nominal model is based on using 43 months as the average period of the 4 year wave. That is the historical average of that wave going back well over 100 years. Hurst stated in the cycles course materials that one of the biggest mistakes students make is using too much data. It takes a little practice in ST but I’ve found using less data removes some of the uncertainty of trough placement.
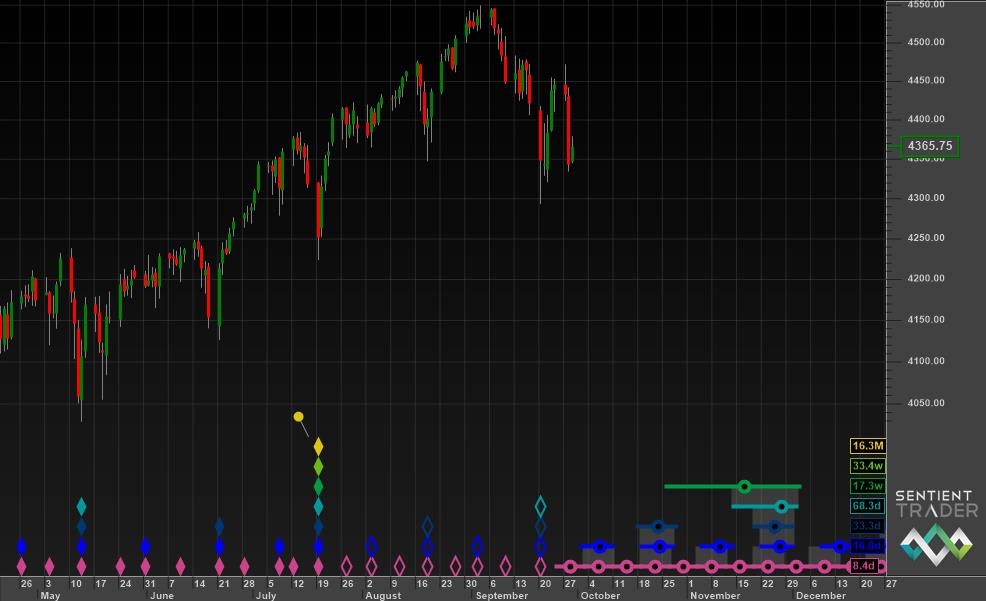
The first chart is the S&P 500 showing the intermediate waves. It shows relatively evenly spaced waves over several years.The longer waves can be added using the great flexibility of ST. If you zoom in you can get a good look at the shorter wave phasing. In November you can see David’s infamous “nest of lows”. For fine tuning you can use intraday data to phase the shortest waves in the data.