The S&P 500 is at an interesting testing point. The way that it behaves over the next few days will help us to resolve some analysis questions. In this quick post I will explain why it is “testing time” for the S&P 500.
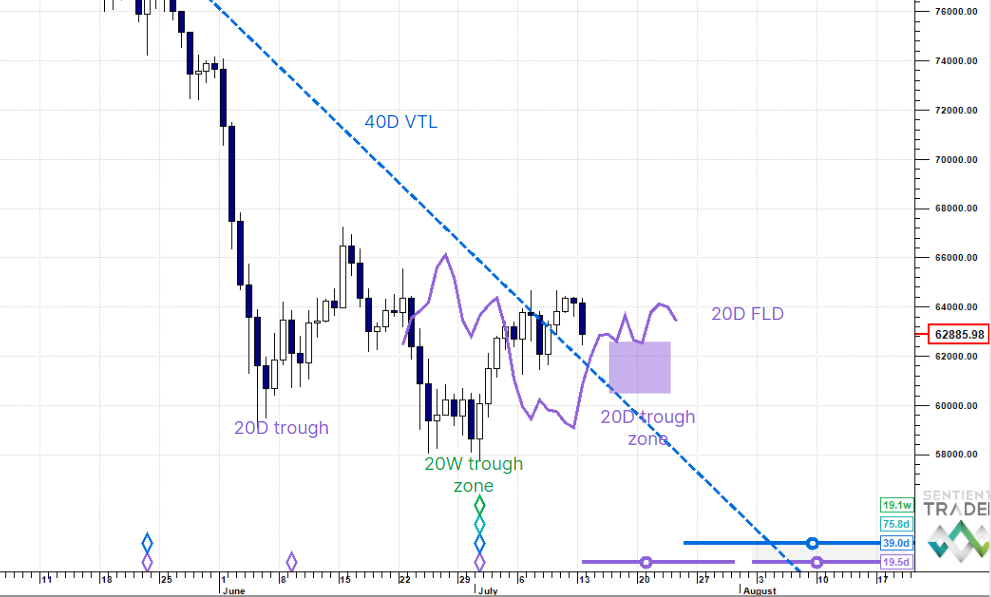
Yesterday the S&P 500 touched the 20-day FLD, in the first interaction between price and the FLD since price crossed above the FLD at the end of July. Here is what that looks like on the default analysis of the S&P 500 (as discussed in my recent YouTube market updates):

The default analysis (which means that I have not influenced it in any way – kind of an “out-the-box” analysis) suggests that the trough on 19 July 2021 was of 20-week magnitude, which means that we expect the FLD to provide support in a B-category interaction with price. (If this FLD approach is new to you, then take a look at this series of videos)
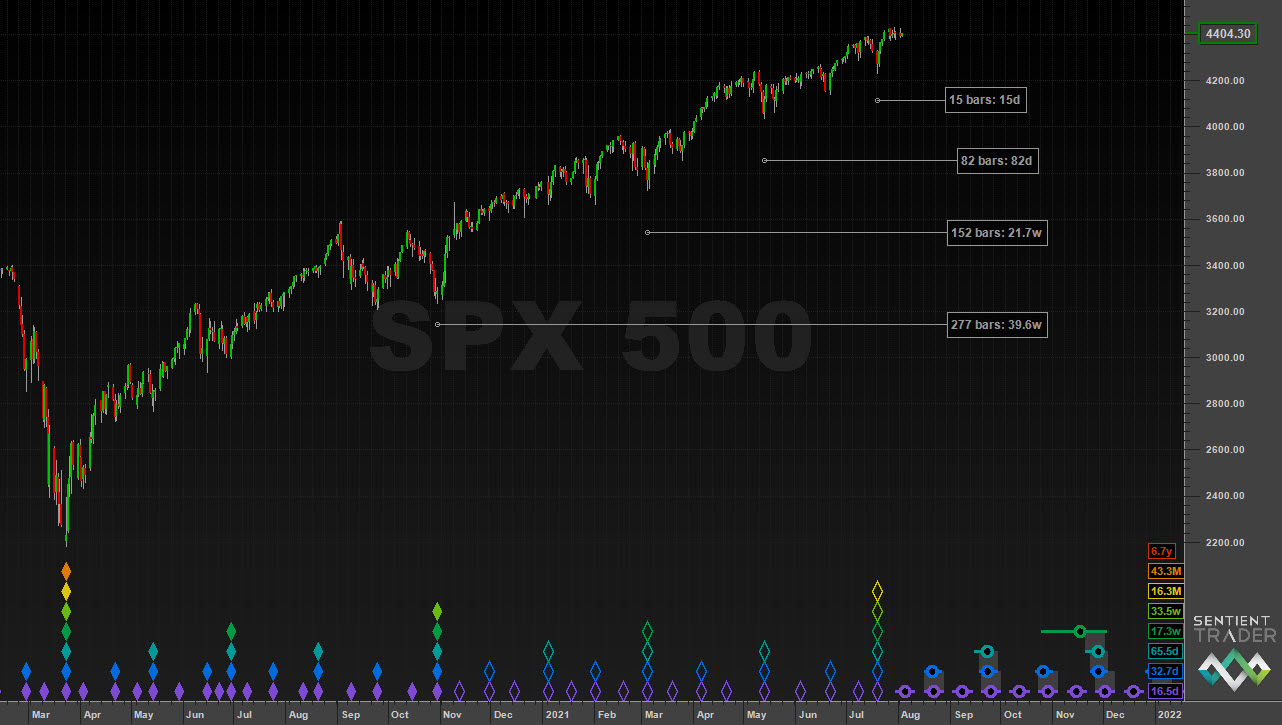
Here is the broader context of that analysis, showing that the 18-month cycle trough is expected in a few months time:

If you have been following the market update videos on YouTube you will know that it is possible the 18-month cycle trough has formed. Here is what that analysis looks like:
And here is the close view of price reaching down to the FLD:

The expectation here is also that the FLD will provide support because it is still a B-category interaction following an 18-month cycle trough (as opposed to a 20-week cycle trough).
However, you will notice that in both of these cases the target generated by price crossing the FLD at the end of July (the A-category interaction) has not been reached. That is a bearish sign – and not what we would expect at all following a 20-week or 18-month cycle trough.
And so what about the third possibility I have discussed recently in the market update videos? This is the least likely analysis in my opinion, which suggests that the 18-month cycle trough occurred even earlier:
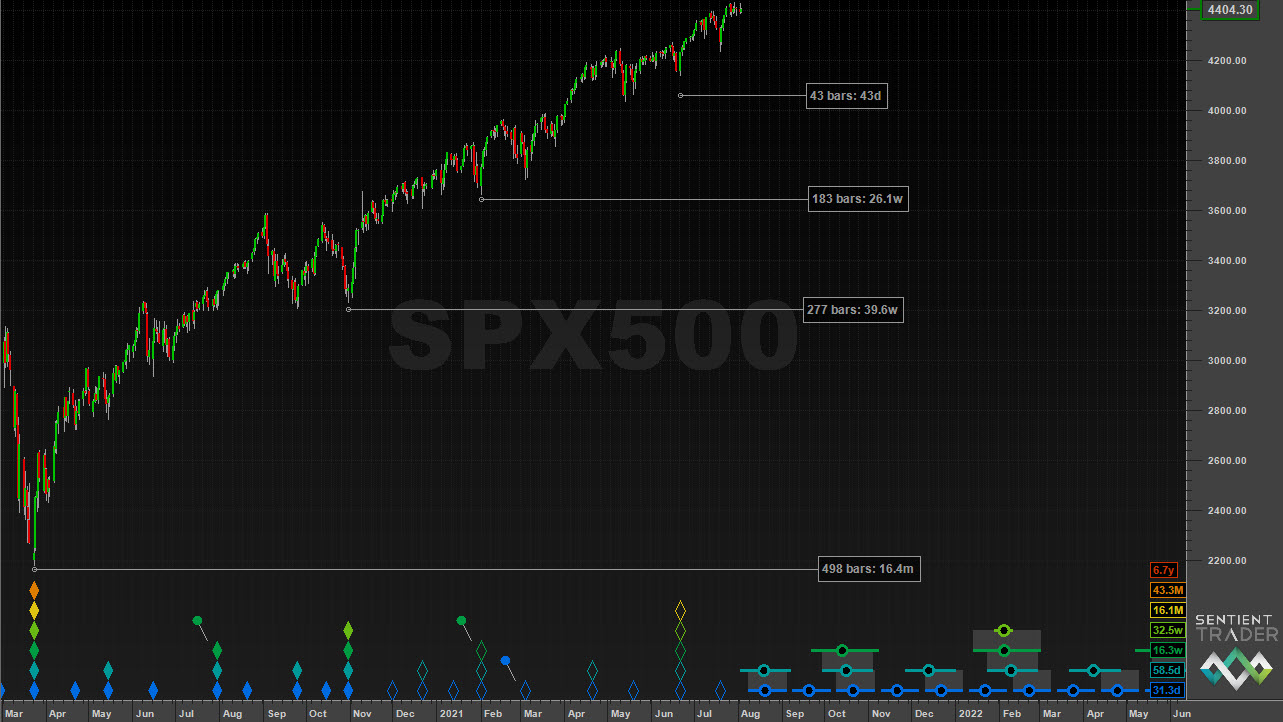
The big difference here is that the big trough (18-month, or it is possible to position the 20-week trough there) occurred on 21 June 2021. Here is a close-up of recent price movement with that analysis:

Interesting to note that, despite the very different analysis, the FLD is in the same position as in the previous analysis – a reminder of the robustness (isn’t robusticity a word?) of the FLD.
Notice the sequence of interactions with the FLD implies that – according to this analysis – we expect an F-category interaction here, and should see price break down on its way to a trough in the third week of August. The earlier analyses also expect a trough later in August – but it would be a 40-day cycle trough, not an 80-day cycle trough. Of the three possibilities this one is the more immediately bearish, with price breaking down below the FLD now, and forming a deeper trough towards the end of August.
In conclusion: the S&P 500 is at a testing point. If the 20-day FLD provides support our confidence in the recent trough will be increased. However if price breaks down below the FLD we will have to consider the less likely analysis options, and will be looking for a lower trough to form later in August.