This post has been kindly provided by Jan Benestad. We thought it was particularly interesting because it discusses a cycle that is not a part of Hurst’s original nominal model.
The analysis is provided for your consideration and is not to be construed as financial advice. Please bear in mind our disclaimers which apply to all posts on this site.
Please note: Any questions about the post will be answered by our team, not by the contributor.
It was after finishing my M.sc in Physics that I late in the 1990s started investing in stocks. Later in the 2000s I started to see a ~6 month cycle, and other shorter and longer cycles. By accident I realised that the stock market was correlated to solar activity and solar cycles. I wasn´t really a trader, but rather trying to be over- or underweight at the right times. I was very successful. After the financial crisis I switched to be a swing-trader (felt more safe), and I had developed some tools for it. For a long time I was again very successful.
Then I started to find interest in a ~3,5 year cycle, and realised that there were other similar cycles in climate, El-Nino, earthquakes, solar activity, planetary zyzygies and so on. As a scientist this was very interesting. But I could never really tie them together, and I lost my focus on the trading which became poor. I also had a family to take care of, so I dropped trading and got back to ordinary work.
But once bitten by the stock market monster, you can never really leave it. So after some time I got back to focusing just on the stock market, just for hobby, to find the right cycles.
So after some tweaking I think I have found the correct ~3,5 year cycle. When analysing these cycles, there appeared to be a pattern where even and odd cycles behaved somewhat different, so there also may be a ~7 year cycle involved. Btw one helpful tool I have been using is wavelets. Sounds complicated, but it is really just an excel-plugin.
So here is the ~3,5 year cycle that I found, actually represented by the 7-year cycle
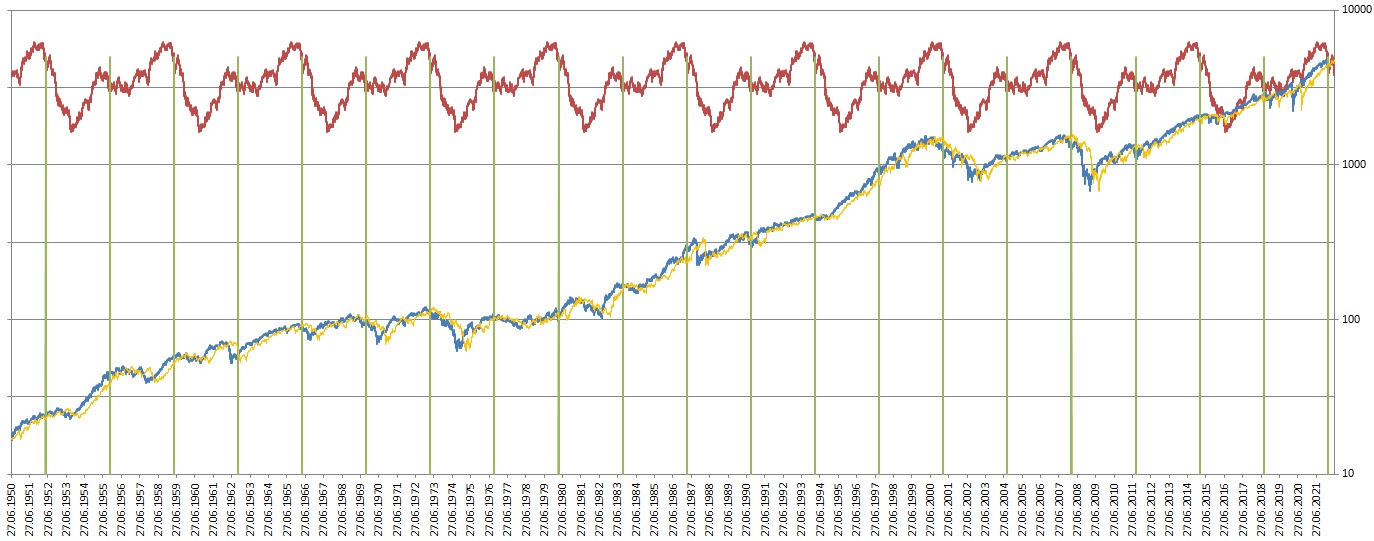
The current location in the 3,5-year cycle is indicated by green vertical lines.
Also notice a ~6 month shifted index (similar to what you call an FLD)
Currently the cycle suggest we are very near a 3,5/7-year cycle high. So what to look for and to expect?
Here is a closer look.
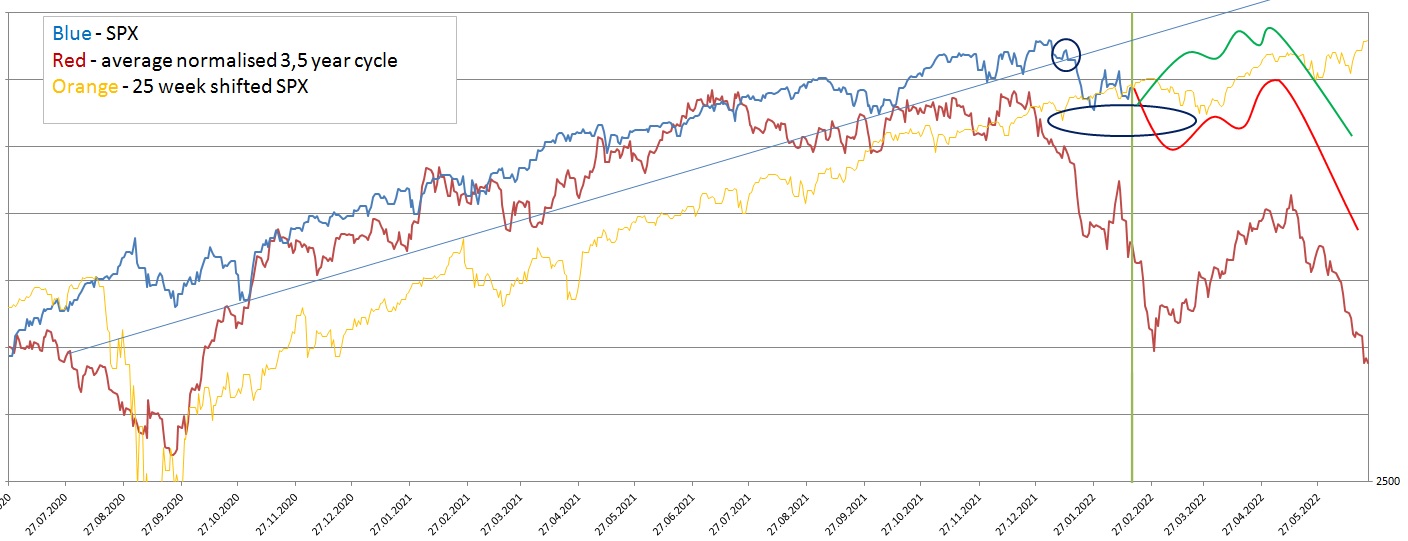
The following is not thoroughly back-tested, but more of a visual observation:
When we are near the cycle top, one should look for an important trendline to be broken (has happened). Next I we should see the “FLD” in orange be broken. So far the “FLD” works as support and has not broken decisively.
I am looking for two scenarios
-either the “FLD” holds, and we could rally to ATH the next few months (I give it ~40-45%). Then the cycle has topped
-or we break down the coming few weeks, bounce up to make a shoulder or even double top, and head down (I give it a ~55-60% chance)
Once the confirmation of the cycle top is in, we start to look for the cycle low. It may be as early as summer 2022, but I think it is more likely to be as late as summer 2023.