In our recent Hurst cycles webinar on 16 October 2017, I discussed the trading opportunity that was presenting itself in the S&P 500 for the market to drop down into an 80 day cycle trough. I also mentioned that I thought the better opportunity would probably come when price bounced out of that 80 day cycle trough because of the current bullishness of the markets. In this post I will consider the possibility that the 80 day cycle trough has occurred and I will be taking a look at some charts from our Hurst Signals system, which identifies trading opportunities according to the FLD Trading Strategy. The situation at the moment is an interesting one and it provides a good example of why Hurst Signals, or the FLD Trading Strategy approach should never be applied automatically, without considering the situation that is presented on the charts. I hope, if you are new to Hurst Signals, and are perhaps struggling to understand how to apply the information within the broader context of what is happening, that this post will help to demonstrate how this should be done.
Here is a chart of the S&P 500:
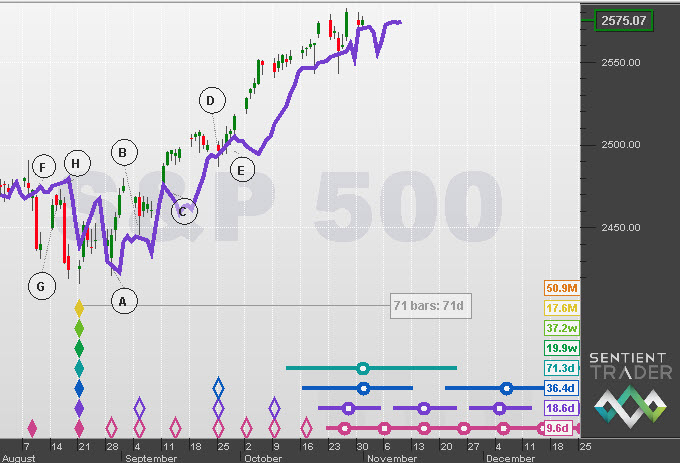
The FLD Trading Strategy trades the reliable sequence of interactions between price the 20-day cycle FLD (the purple line on the chart). That sequence is identified as a series of letters from A-H. The most recent interaction on this chart is the E category interaction as price bounced out of the 40 day cycle trough in late September. The next interaction is expected to be an F category interaction as price drops down below the 20 day FLD and falls to the 80 day cycle trough. At the foot of the chart we can see the nest of lows for that 80 day cycle trough which is fairly well aligned over last week, into early this week. We can also see that price has in fact interacted with the 20 day FLD by coming down to it, finding support at the line and bouncing back up again. The Hurst Signals system is still telling us to expect an F category interaction next because under normal circumstances price will drop below the 20-day FLD on its way to that 80-day cycle trough.
However this is where the subtlety of trading comes into play. I mentioned “under normal circumstances”, which is really just another way of saying: “when the market is not unusually bullish or bearish”. Are we looking at a chart which is not unusually bullish or bearish at the moment? I would suggest that the answer to that is fairly obvious. No! The market is currently very bullish, and I could make this an extremely long post explaining all the reasons why that is a very bullish market, but I shall limit myself to one simple reason: the peaks, or high points of each of the moves in that market are occurring late, in other words to the right. We are not seeing balanced up and down moves, but long and strong upward moves, followed by much shorter and weaker downward moves. That is a bullish market.
So what do we expect out of our F category interaction, which should be taking price down to the 80 day cycle trough? As I mentioned in the webinar two weeks ago, when a market is bullish we expect the move down into the 80 day cycle trough to be disappointing. It is very possible that the move down to the 80 day cycle trough brought price down to the 20 day FLD, and no further. Therefore it is possible that the 80 day cycle trough formed last week, and that what we are seeing now is the bounce out of that trough.
I hope that you can see how in this situation it would be wrong to be blindly following the trading opportunity advice of the Hurst Signals system, and to be entering into a short F category trade, if there is the possibility that the 80 day cycle trough has already formed. Of course my assessment that the 80 day cycle trough might have formed could be wrong, and we might see a strong move down into an 80 day cycle trough that still lies ahead. My point is not to make absolute statements about whether a trough might or might not have formed only a few days ago. My point is that any trading decision should be taken with careful consideration of the possibilities. And in my opinion because there is the possibility that the 80 day cycle trough might have occurred, it would be a mistake to enter into a short trade at this time in order to benefit from the move down into that 80 day cycle trough.
One of the best ways of helping to understand whether a trough or peak has or has not yet occurred is to look at other correlated markets to see whether they provide any additional information. Here is a chart of the Dow Jones Industrial Average:

Here again we can see that the next interaction is expected to be an F category interaction. There are some subtle differences on this chart, which include the fact that the 80 day cycle nest of lows is centered around this week, the first week of November as opposed to last week. And price has not yet interacted with the 20 day FLD, as it did in the S&P 500. But here too a short trade at this moment seems ill-advised. Firstly the market has clearly been very bullish, and there is no evidence that that bullishness has diminished as it should have if it was coming from the 80 day cycle. It seems likely that this bullishness is coming from the longer cycles, and therefore a short trade now into the 80 day cycle trough would be a trade against the bullish influence of those longer cycles. And secondly, even if price did fulfill the targeted projection following a cross below the 20 day FLD, that would not be a very significant (or profitable) move.
But the DJIA doesn’t really sway the argument one way or another. Let’s take a look at a chart of the NASDAQ:

The NASDAQ provides us with some very interesting information, because of a few subtle differences. First of all the nest of lows for the 80 day cycle trough is a few days earlier, and is lined up very neatly beneath the trough that formed last week. That doesn’t prove that it was the trough of the 80 day cycle of course, but it certainly increases the chances. Now observe the interaction between price and the 20 day FLD on this chart. Notice how the Hurst Signals system has identified a completed sequence, and has actually labelled the most recent cross above the FLD as the start of the next sequence, an A category interaction.
Of course the 80 day cycle trough does not necessarily have to happen on the same day in each one of these three markets, but because they are so highly correlated it is likely that the trough will (or perhaps did) occur either on the same day, or very close to one another.
Another interesting thing to do when considering the situation in the US stock market is to take a look at markets in other countries. That provides further insight, although of course the correlation between the markets is less exact, and does not provide such direct evidence.
And so all things considered, I think that it is very possible that the 80 day cycle trough has occurred. But the important thing for me is not to be right in terms of the analysis, but to be profitable in terms of the trading that I am doing as a result of that analysis. I might well be wrong about the 80 day cycle trough having formed, but my ego can take that! The important thing is not to have lost money by making a trade that is ill-advised. And entering into a short trade now doesn’t seem to me to be the best idea.
Why then is the Hurst Signals system still identifying the F category trade as the next trading opportunity? Because the Hurst Signals system strictly adheres to the identification of the interactions between price and the FLD. This emphasizes the importance of not blindly following what the Hurst Signals system tells you is coming next. I believe the same is true of any trading methodology, but that is probably a discussion for another time. The important thing here is to use the Hurst Cycles analysis and the identification of the interaction between price and the FLD as a starting point to begin your identification of trading opportunities. The subtlety of our thinking process, and the fuzzy way in which we are able to understand the complexity of any situation is a vital part of the profitable application of a trading methodology.
This post appeared first on hurstcycles.com