You will come across specific terms in these notes (FLD, VTL, and so on). Rather than explain them each time, you will find definitions here: guidance notes for Hurst cycles terminology
VIX Index – testing key support in 20 week nest-of-lows.
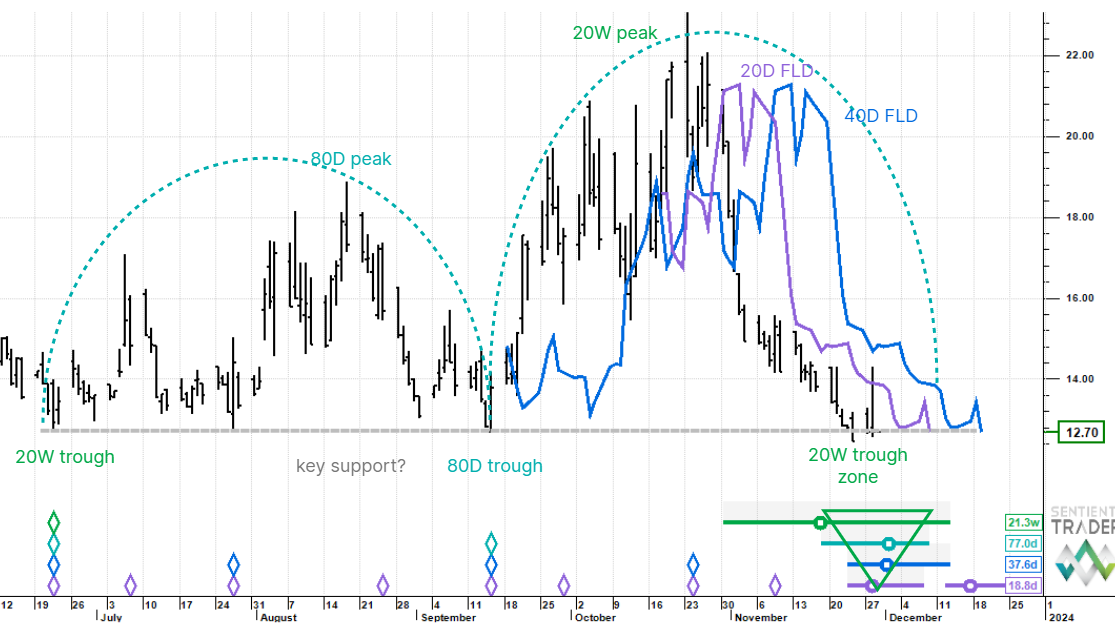
The chart describes the arc of a 20 week cycle starting in June and divided into its two constituent 80 day cycles. As you can see we have a stack of future trough circles (a nest-of-lows) up to 20 week cycle magnitude just under current price. Moreover, we are testing a triple bottom support ledge which goes back to the start of the 20 week cycle. For that reason alone, and whatever the cycle analysis view turns out to be, this is a chart one would want to dig into in a bit more detail. In simple terms volatility has made a full retrace. What we need to start the confirmation process for the 20 week cycle trough is a clean break of median price up through the 20 day FLD just sub 14. Thereafter a cross over the 40 day FLD (at 14 next week, dipping to 13 the week after) would firm up the view that a large scale upside reversal could have begun. At this stage in the equity index cycle it would imply a sell off – and expansion in volatility.
This post was first published on Hurst Cycles Notes.