The US markets squeezed up to new highs over the past week, reminding me why I always treat the “confirmation of a peak” information provided by a VTL cross with a small dose of skepticism (see this post about the breaching of the 20-week VTL).
The next cycle event that I am looking out for is the formation of the 40-week cycle trough. When can we expect it?
To receive these blogs as soon as they are posted Join/Like/Follow Us. If you don’t do social media – click to Join Feedburner to receive these blogs by email.
In the recent Hurst Trading Room podcast I discussed the possibility that the trough that formed in stock markets around the world on 7 May 2015 might be a trough of the 80-day cycle, as opposed to a trough of the 40-day cycle. The jury is still out in my opinion, but there is a good argument in support of the 80-day cycle trough. The first piece of evidence is the 204 days that elapsed between the October 2014 trough and May 2015 trough. 204 days is exactly one 20-week cycle (of average 136 day length) and one 80-day cycle (of average 68 day length).
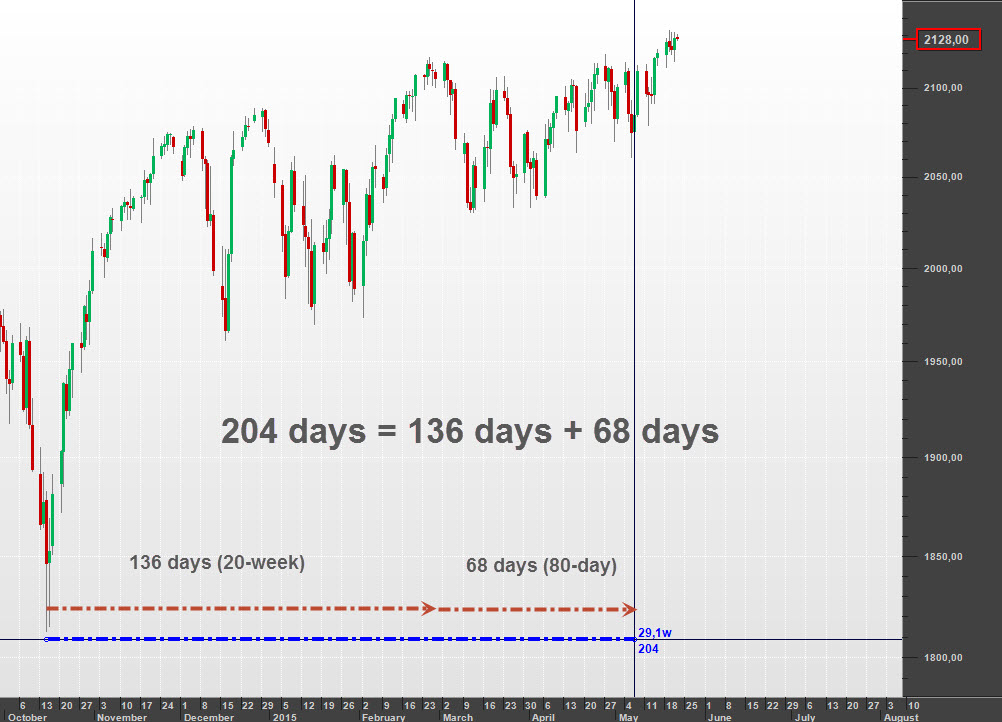
Whenever I see a trough forming at exactly the average time of a combination of cycles I pay attention. Cycles are often distorted, and are subject to constant variation in wavelength (and amplitude) which makes analysis a difficult art at times. But when the numbers work out exactly it is often an indication that the mists of analysis uncertainty are clearing.
Here is the analysis in the S&P 500 with the 80-day cycle trough on 7 May 2015:
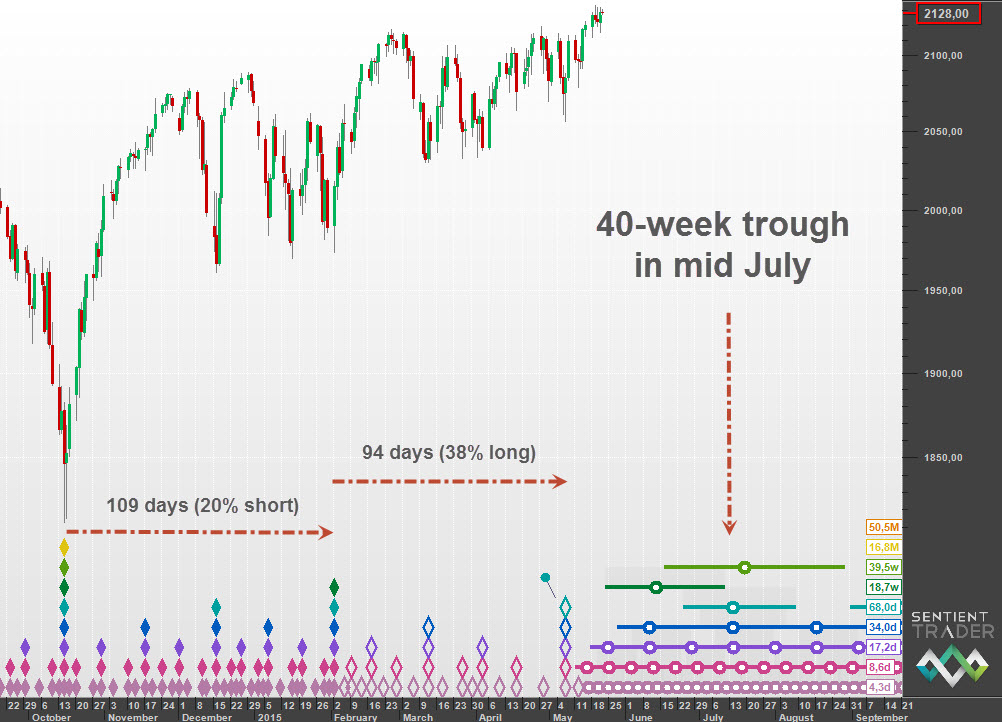
Interestingly this analysis shows a steady and dramatic lengthening of cycle wavelengths, from a 20% short 20-week cycle between October 2014 and February 2015, to a 38% long 80-day cycle from February 2015 to May 2015. The lengthening of cycle wavelengths could be seen as a bearish sign because it indicates a shifting of underlying trend from bullish to bearish (or very bullish to less bullish).
The analysis suggests that the 40-week cycle trough is expected to form in mid July 2015.
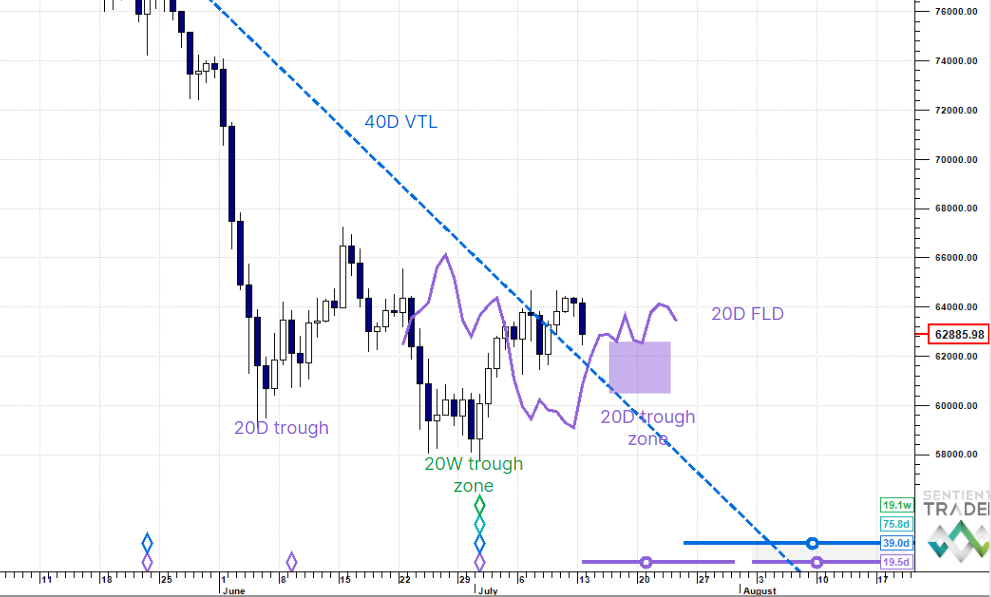
By contrast here is the alternate analysis, with the May 2015 trough as a trough of the 40-day cycle:

This is by no means an out-of-the-question analysis. In some ways it is a more satisfying analysis because it shows less of a dramatic change in the cycle wavelengths. This analysis expects the 40-week cycle trough sooner, in early June 2015.
One of the reasons that I prefer the former analysis, with the 80-day cycle trough in early May 2015 is because it is a valid analysis across many markets. If you would like to see the analyses of the DJIA and DAX then please take a look at the full post on the Hurst Cycles site.
Owing to the almost-fractal nature of cycles in the market we will see a trough form in early June no matter which analysis is correct, but I favor the option of that trough being of 40-day magnitude, and expect the 40-week cycle trough to form in July. It will be interesting to see whether price manages to remain above the 40-week FLD on its way down to the trough.